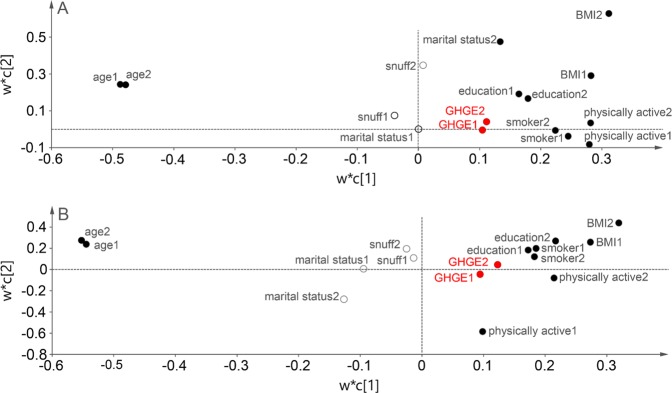
Figure 3.
(A,B) Results from PLS modelling of individual characteristics influential to greenhouse gas emissions (GHGE) per 1000 kcal and day for women (panel A) and men (panel B) in the Västerbotten Intervention Programme. w*c [1] and w*c [2] indicate the weights for the different characteristics in relation to the outcome GHGE for the two most important components c [1] and c [2] created among the individual characteristics. Values related to study visit 1 are indicated with “1” and values related to study visit 2 with “2”. Filled circles indicate influential and open circles non-influential characteristics. Variables located close to or to the right of GHGE are associated with high levels and those to the left with low levels. BMI, body mass index; PLS, Partial Least Squares.

