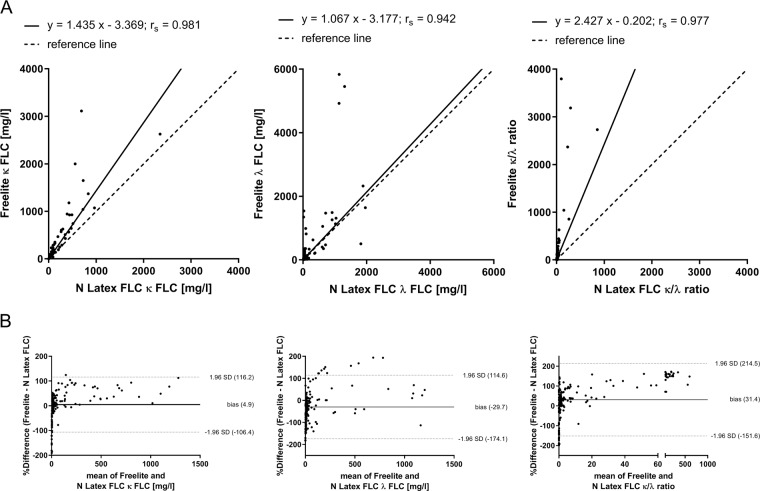
Fig. 1. Comparison of N Latex FLC with Freelite in the determination of FLC.
Passing–Bablok (a) and Bland–Altman (b) analyses were performed using 187 serum samples from patients with newly diagnosed or relapsed multiple myeloma (MM, n = 33), light-chain multiple myeloma (LCMM, n = 8) or smoldering multiple myeloma (SMM, n = 6). Shown are the results for the determination of κ and λ FLC and κ/λ ratio determined by N Latex FLC and Freelite. Bland–Altman plots reveal agreement between N Latex FLC and Freelite. A positive bias indicates higher values for the determination of FLC by Freelite compared with N Latex FLC. For a better representation of FLC results, two samples with extreme κ FLC results were not shown (sample 1: κ FLC results of Freelite: 14500 mg/l, N Latex FLC: 11200 mg/l, Sebia FLC: 3456 mg/l; sample 2: κ FLC results of Freelite: 31800 mg/l, N Latex FLC: 5880 mg/l, Sebia FLC: 6093 mg/l).

