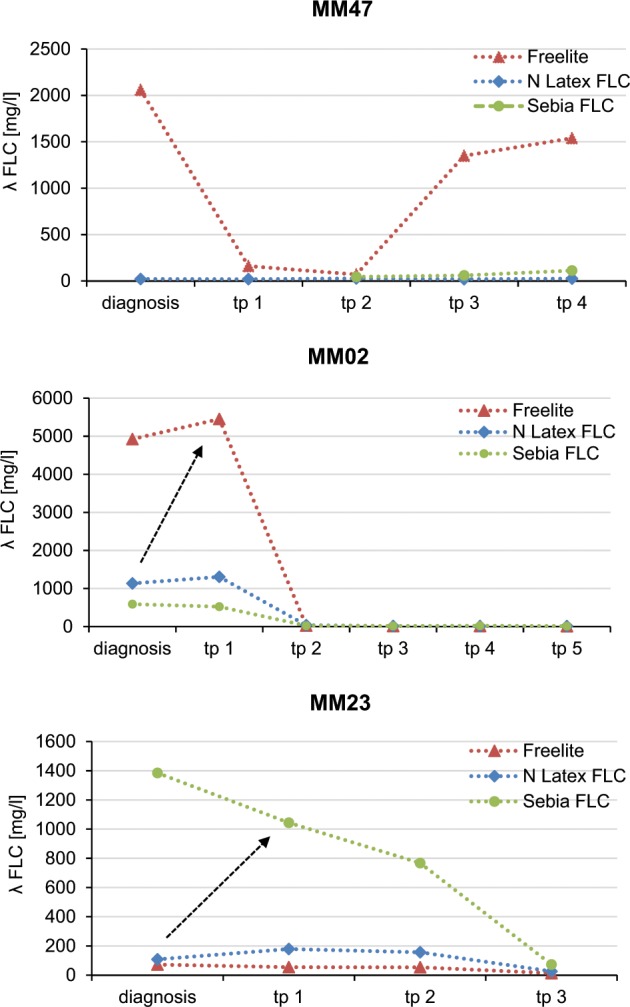
Fig. 3. Discrepancies of light-chain values in the clinical course of treatment.

Shown are λ FLC concentrations measured by Freelite, N Latex FLC, and Sebia FLC in clinical course of patients with clinically leading λ LCMM at indicated time points (tp). Patient MM47 represents a clinical course with partial response under initiated therapy resulting in a later documented progressive disease (measured by Freelite). Sebia FLC measurements, which were only accessible for time points 2–4, showed a markedly lower λ FLC. N Latex FLC results did not detect pathological λ FLC concentrations. Patient MM02 represents clinical stable disease after the first follow-up (measured by Freelite). λ FLC determination by Sebia FLC or N Latex FLC at diagnosis with response assessment with Freelite at tp1 might have lead to the wrong conclusion of progressive disease (indicated by arrow). Finding of markedly higher values can be observed also the other way around: in patient MM23, Sebia FLC detected markedly higher λ FLC values compared with Freelite and N Latex FLC.
