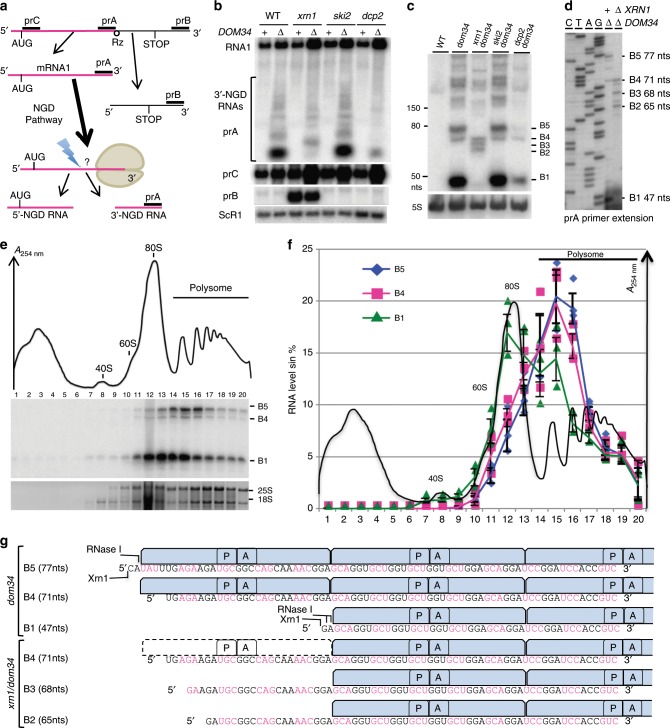
Fig. 1. Size characterization of 3′-NGD RNA fragments and ribosomal association.
a Schematic view of the URA3Rz mRNA showing the ribozyme (Rz) site (see also Supplementary Fig. 1a). Translational start (AUG) and stop codons are indicated. RNA1 (in magenta) is the stop-codon-less mRNA following ribozyme cleavage. Probes prA, prB and prC used in northern blots analysis are indicated. 5′ and 3′-NGD RNAs are the products of NGD cleavage of mRNA1. The lightning flash represents the NGD endonucleolytic cleavage and probe prA is designed for the detection of all potential 3’-NGD RNAs (see also Supplementary Fig. 1a). b Agarose gel electrophoresis followed by northern blot showing levels of mRNA1 and 3′-NGD RNA fragments in the indicated strains. The ScR1 RNA served as a loading control. c Analysis similar to b using 8% PAGE. The 5S rRNA served as a loading control. d Primer extension experiments using probe prA to determine the 5′-end of 3′-NGD RNAs. B1, B2, B3, B4 and B5 RNAs shown in c are indicated with the corresponding size in nucleotides (nts) calculated by primer extension. e Analysis of 3’-NGD RNA association with ribosomes in dom34 mutant cells. Upper, on ribosome profile, positions of 40S and 60S subunits, 80S and polysome are indicated. Panel below, 20 fractions were collected and extracted RNAs were analysed similarly to c. Bottom panel: 18S and 25S rRNAs are shown as references for ribosome and polysome sedimentation, using 1% agarose gel electrophoresis and ethidium bromide staining. f Distribution of the 3′-NGD RNAs analysed in e. For each fraction, levels of B1, B4 and B5 RNAs were plotted as a % of total amount of B1, B4 and B5 RNAs, respectively. The profile in e is reported in f. g Schematic view of the ribosome positioning on 3’-NGD RNAs combining information on size resolution, ribosomal association (Fig. 1), and RNase ribosomal protection of 3’-NGD RNAs (Supplementary Fig. 1). Codons are shown in black or magenta. A and P are ribosome A- and P-sites, respectively. Error bars indicate standard deviation (s.d.) calculated from three independent experiments. Source data are provided as a Source Data file.

