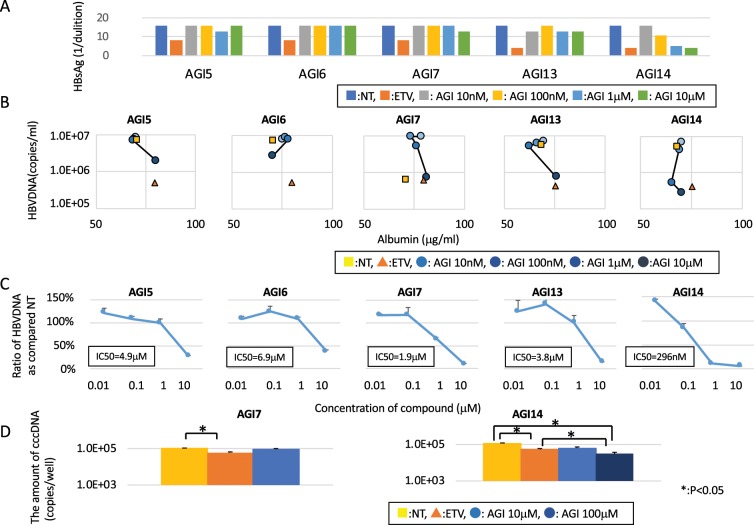
Figure 2.
Alpha-glucosidase inhibitor candidates’ effect on HBV replication. (A) HBsAg level after treatment with alpha-glucosidase inhibitor candidates. HBsAg levels in the supernatant for corresponding alpha-glucosidase inhibitor candidates on day 22. The vertical axis depicts the dilution level of HBsAg in the medium. (B) The relationship between HBV-DNA and human albumin. The line chart and bar graph show the amount of HBV-DNA (right vertical axis) and the relative amount of HBsAg (left vertical axis), respectively. (C) The relationship between HBV-DNA and the concentration of alpha-glucosidase inhibitor candidates. The vertical and horizontal axis is the ratio of HBV-DNA in non-treated samples and the concentration of alpha-glucosidase inhibitor candidates, respectively. Each IC50 is also described. (D) The level of cccDNA in PXB cells. An asterisk indicates a significant difference (p < 0.05). Each experiment was repeated three times.

