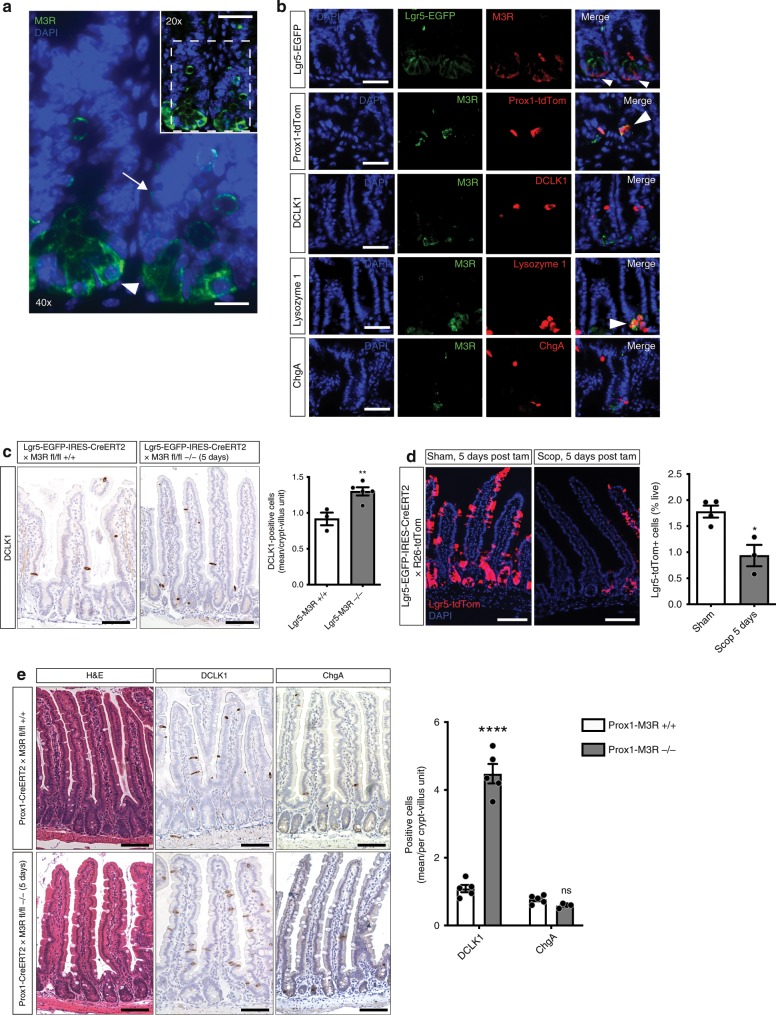
Fig. 2. Muscarinic receptor blockade reduces Lgr5-positive ISC tracing and sensing Prox1-positive endocrine cells primarily orchestrate tuft expansion.
a Immunostainings for M3R showed distribution of the receptor in the crypt base cell compartment (white arrowhead) as well as in cells in positions +4 to +5 of the crypt (white arrow); bar graph top = 50 µm; magnification = 25 µm. b Representative pictures of co-stainings of M3R with intestinal tissue from Lgr5-EGFP-IRES-CreERT2 and induced Prox1-CreERT2 × R26-tdTom mice, respectively, and WT tissue stained for DCLK1, Lysozyme 1, or ChgA (the stainings were repeated at least twice per antibody; positive overlap indicated with white arrowheads); bar graphs = 50 µm. c DCLK1-positive tuft cell frequency within the Lgr5 lineage following M3R ablation in Lgr5-EGFP-IRES-CreERT2 × M3R fl/fl mice 5 days after induction (n = 3 Lgr5-EGFP-IRES-CreERT2 × M3R fl/fl +/+ mice, Mean = 0.917, SEM = 0.088; n = 5 Lgr5-EGFP-IRES-CreERT2 × M3R fl/fl −/− mice, Mean = 1.3, SEM = 0.057; unpaired t test, two-tailed, t = 3.848, df = 6); bar graphs = 100 µm. d Lgr5-positive ISC tracing is reduced following nonselective muscarinic receptor antagonism (n = 4 mice sham, Mean = 1.78, SEM = 0.1151; n = 3 mice scopolamine, Mean = 0.9367, SEM = 0.2050; unpaired t test, two-tailed, t = 3.851, df = 5); bar graphs = 100 µm. e In contrast, ablation of M3R in Prox1-positive endocrine cells resulted in robust DCLK1-positive tuft cell expansions 5 days after induction of Prox1-CreERT2 × M3R fl/fl mice (n = 5 Prox1-CreERT2 × M3R fl/fl +/+ and M3R fl/fl −/− mice for DCLK1, n = 5 Prox1-CreERT2 × M3R fl/fl +/+ mice, n = 4 Prox1-CreERT2 × M3R fl/fl−/− for ChgA; Prox1-CreERT2 × M3R fl/fl +/+ DCLK1 Mean = 1.090, SEM = 0.109; ChgA Mean = 0.77, SEM = 0.054; Prox1-CreERT2 × M3R fl/fl −/− DCLK1 Mean = 4.480, SEM = 0.286, ChgA Mean = 0.588, SEM = 0.031; ordinary two-way ANOVA, DCLK1 t = 14.90, df = 15; ChgA t = 0.7565, df = 15); bar graphs = 100 µm. Source data are provided as a Source Data file. *p < 0.05, **p < 0.01, ****p < 0.001, ns not significant.

