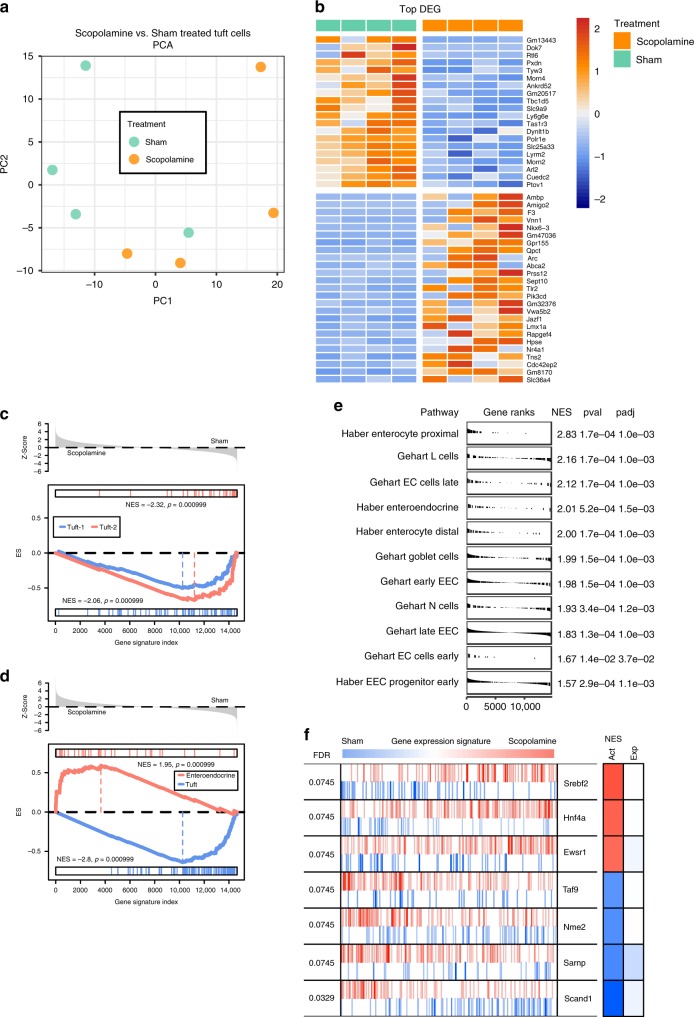
Fig. 3. RNA-sequencing analysis indicates adoption of enteroendocrine differentiation of expanding tuft cells following scopolamine treatment.
a Scopolamine-treated Dclk1-DTR-ZSgreen-positive samples (n = 4 mice) show spatial separation from sham treated samples (n = 4 samples) along PC1 employing principal component analysis (PCA). b Top 25 differentially expressed genes (DEG) between the indicated groups, scale bar indicates log2-fold changes of genes (Z-Scores; positive lgFC indicates higher gene expression in the respective group). c Gene set enrichment analysis (GSEA) indicates negative correlation to previously described tuft-1 (neuronal) and tuft-2 (immune) phenotypes following scopolamine treatment; ES enrichment score. d Instead, tuft cells strongly enrich for enteroendocrine cell lineage signatures. e GSEA analysis of published enteroendocrine signature gene sets shows the adoption of an enteroendocrine progenitor subtype as well as increased differentiation into early and late EC cells, L cells and N cells of expanding tuft cells13,32 (see Supplementary Data 1 for leading edge gene signatures); the enrichment for enterocyte signatures further confirms increased differentiation. EEC enteroendocrine cell, EC enterochromaffin cell, NES normalized enrichment score. f Master regulator analysis shows significant changes in transcription factor activity after scopolamine treatment, such as activation of Srebf2 and inactivation of Nme2, respectively (Z-Scores; Srebf2 p = 0.00086; Hnf4a p = 0.0014; Ewsr1 p = 0.0019; Taf9 p = 0.0019; Nme2 p = 0.0015; Sarnp p = 0.0011; Scand1 p = 0.00012). FDR false discovery rate, Act differential activity (red indicating increased, blue indicating decreased), Exp differential gene expression.

