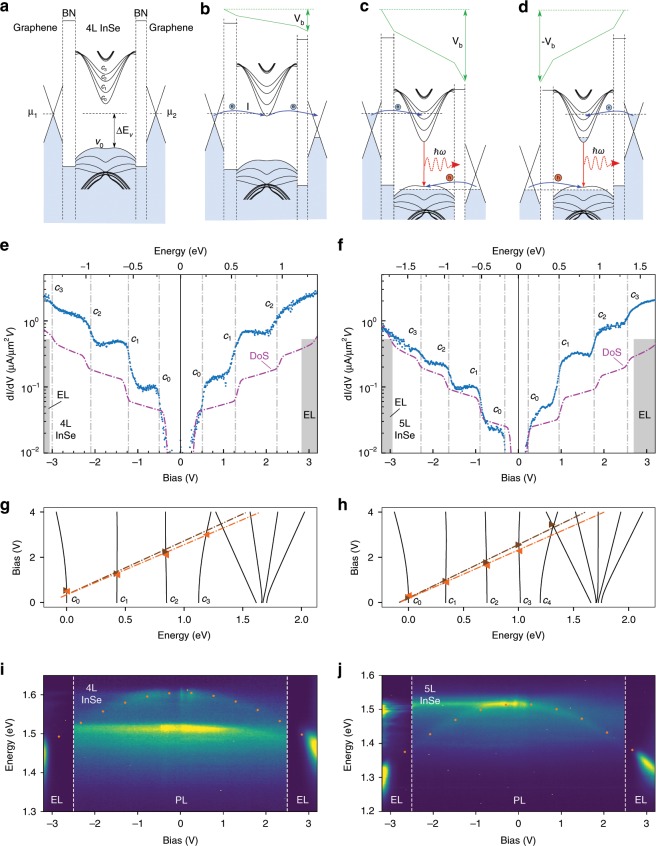
Fig. 2. Resonant tunneling spectroscopy of few-layer InSe crystals at T = 4.2K.
Band alignment in 4L InSe device, for unbiased (a), weakly biased (b) and strongly biased in forward (c) and reversed (d) configurations. (blue) and density of states (DoS) of the conduction bands from tight binding model (purple, arb. u.) for 4L (e) and 5L (f) InSe film, with the number of layers established by AFM topography. Energy scale along the top axis was found using the EL onset values. Calculated evolution of the conduction subbands with bias for 4L (g) and 5L (h) InSe (higher energy bands are also shown). Symbols indicate the bias at which the steps were measured in (e) and (f) for forward (brown) and reverse (orange) directions. Evolution of PL and EL with bias for 4L (i) and 5L (j) InSe. The orange dotted line indicates electrostatic calculations of the band gap reduction with electric field, non-dispersive line near 1.5 eV is due to hydrocarbon contamination located outside the sample.

