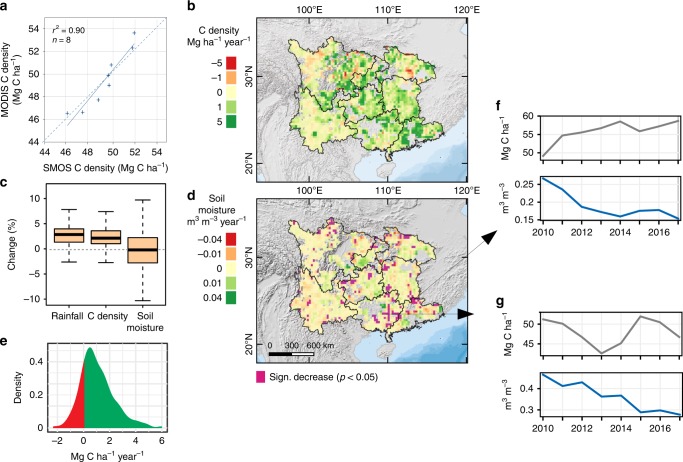
Fig. 2. SMOS-based carbon density and soil moisture changes 2010–2017.
a Comparison of independent MODIS- and SMOS-based aboveground C density estimates (annual averaged values of the study area). b SMOS aboveground C density trends during 2010–2017. c Changes (in %) of CHIRPS rainfall, SMOS C density and SMOS soil moisture during 2010–2017. Boxplots show whiskers, quartiles and median across 25 × 25 km2 pixels. d Spatial distribution of SMOS soil moisture trends during 2010–2017 (n = 2279 pixels). Transparent areas have been disregarded for insufficient data quality. Significant negative trends (p < 0.05) are shown in purple. e Density plot showing the distribution of SMOS aboveground C density trends in the purple areas of d with a significant (p < 0.05) decrease in soil moisture (n = 172). f Example of an area with a significant (p < 0.05) decrease in soil moisture and a strong increase in C density. g Example from Guangxi province showing an area with large-scale tree plantation and massive harvest in 2013 and a significant (p < 0.05) decrease in soil moisture.

