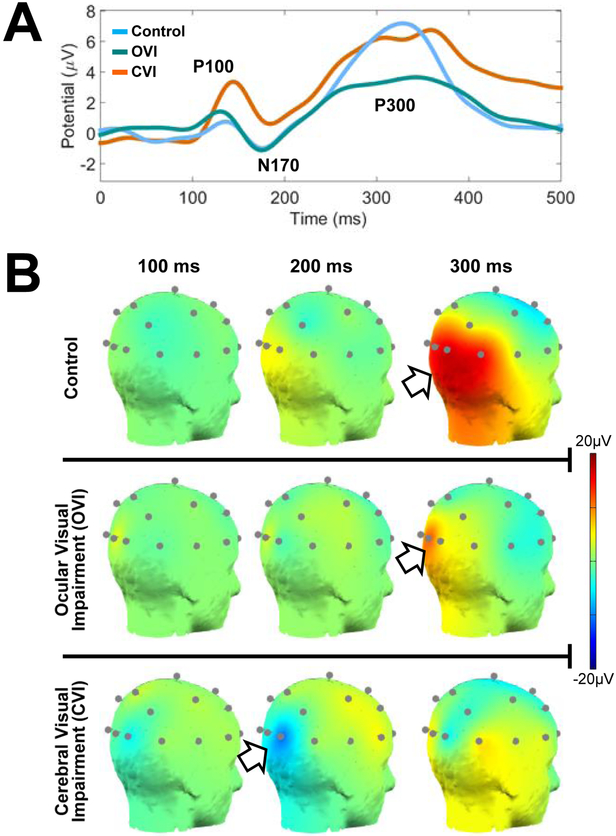
Figure 3. Visual search combined with EEG data collection.
A) Event related potentials (ERP) for control, ocular visual impaired, and CVI groups in response to the virtual toy box visual search task. Data represents averaging over occipital pole nodes for the first 500 ms after stimulus onset. Note how controls demonstrate well-formed P100, N170, and P300 events. Ocular visually impaired subjects display similar latencies as controls, but with a reduced magnitude of the P300 event. Note that in the CVI group, there are latency delays at all three events (greatest at P300) and noticeable variations in peak amplitudes. B) Scalp map plots of 20 channel EEG data obtained from representative individuals from all three groups in response to the virtual toy box task (posterior view, right side). Scalp maps are displayed at the 100, 200, and 300 ms intervals. The occipital-parietal signal observed in the control (top row) appears robust and peaks just past 300 ms after stimulus onset. The ocular visually impaired individual (middle row) shows less robust and a weaker peak within the occipital pole at 300 ms. The individual with CVI (bottom row) reveals a delayed N170 that peaks close to 200 ms and a delayed P300 that does not peak until close to 375 ms. Note further how the occipital signal does not appear as robustly sustained along the occipital-parietal areas as it is in the control participant. Adapted from (Bennett, et al., 2019).

