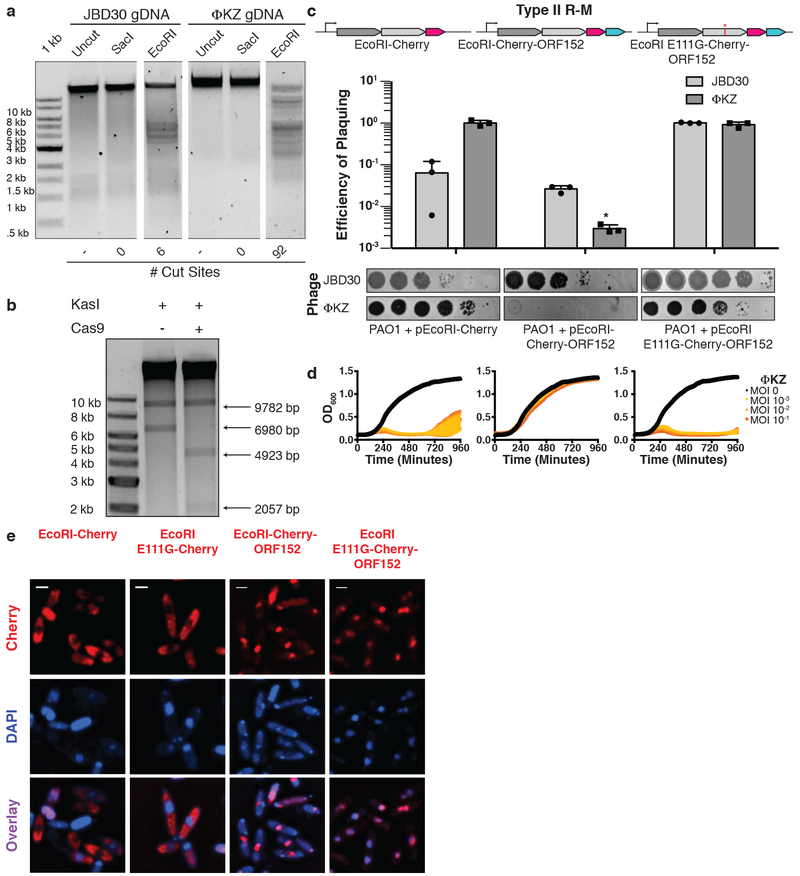
Figure 3: ΦKZ genomic DNA can be cleaved by immune enzymes.
a, ΦKZ and JBD30 genomic DNA digested with the indicated restriction enzymes in vitro. The first lane contains a 1 kb DNA ladder. The number of cut sites for each enzyme is shown at the bottom of the gels. Products were visualized on a 0.7% agarose gel, visualized with SYBR Safe nucleic acid stain. b, ΦKZ phage genomic DNA digested in vitro using KasI, and incubated with and without Cas9 loaded with crRNA:tracrRNA targeting the fragment liberated by KasI. Products were visualized on a 0.7% agarose gel, visualized with SYBR Safe nucleic acid stain. c, Strain PAO1 expressing EcoRI-Cherry, EcoRI-Cherry-ORF152, or EcoRI E111G-Cherry-ORF152 fusion protein. Plaque assays were conducted as in Fig. 1a and quantified (n=3). Mean values are plotted as bars with error bars representing standard deviation. A t-test comparing ΦKZ EOP on PAO1 pEcoRI-Cherry to PAO1 pEcoRI-Cherry-ORF152 yielded a p-value of 2.88×10⁻⁴. d, Growth curves monitoring the OD600 of PAO1 cells infected with the indicated ΦKZ multiplicity of infection (MOI). e, Live fluorescence imaging of infected P. aeruginosa strains engineered to express EcoRI-Cherry, EcoRI E111G-Cherry, EcoRI-Cherry-ORF152 or EcoRI E111G-Cherry-ORF152. DAPI stain shows the phage DNA. Cherry shows EcoRI fusion protein. In vitro digestion experiments a and b replicated twice with similar results. Plaque assays (c), growth curves (d), and microscopy (e) were replicated ≥ 3 times.

