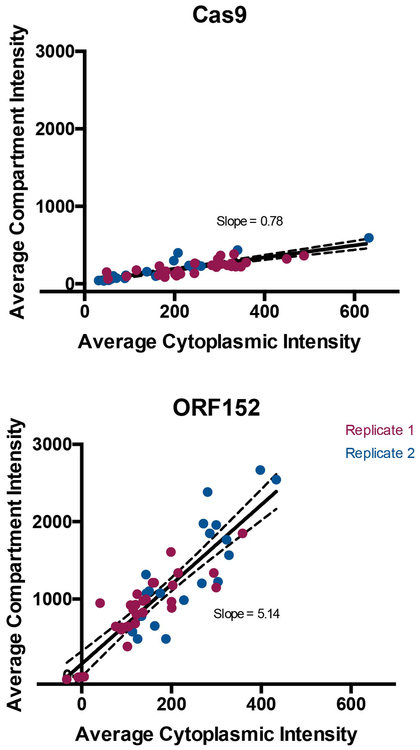
Extended Data Figure 4: Quantification of Cas9 localization during phage ΦKZ infection of P. aeruginosa.
Localization of Cas9 and ORF152 in the cytoplasm and shell during ΦKZ infection were quantified. Data points (individual cells) from two pooled replicate experiments were fitted with a line, showing 95% confidence intervals with dashed lines. The slope is as reported in the plots.

