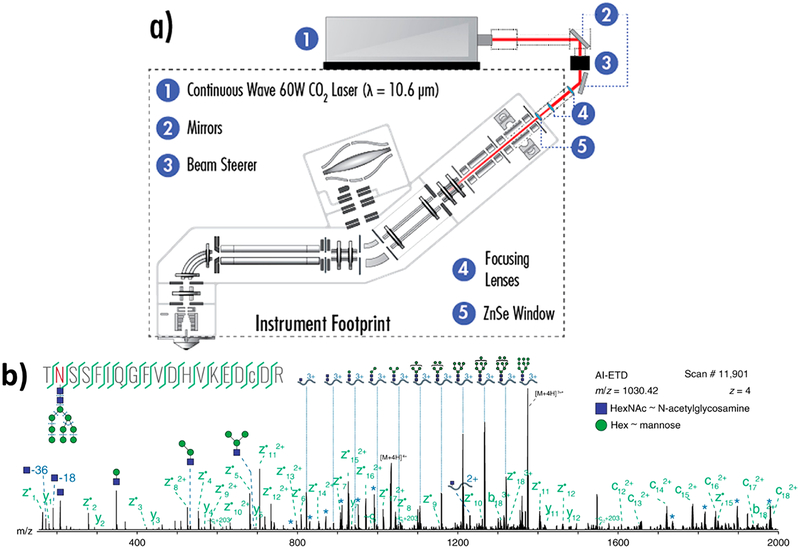
Figure 5.
(a) Instrument schematic for activated ion-electron transfer dissociation (AI-ETD).41 (b) Annotated single AI-ETD spectrum (i.e., no averaging) of N-glycopeptide TN*SSFIQGFVDHVKEDcDR modified with a high mannose-type glycan [HexNAc(2)Hex(9)]. The red asparagine indicates the site of glycosylation, and the lowercase cysteine indicates carbamidomethylation. Green fragments are products from peptide backbone cleavage; triply-charged y ions are annotated along the top, and b ions include only glycan moieties. Blue asterisks (*) denote doubly- and quadruply-charged y ions (from 1700 to 2000 and 750 to 1000 Th, respectively), each which differ by one hexose residue. Peptide fragments retain the glycan modification unless denoted by a “~”.135 Adapted from Riley, N. M.; Westphall, M. S.; Hebert, A. S.; Coon, J. J. Implementation of Activated Ion Electron Transfer Dissociation on a Quadrupole-Orbitrap-Linear Ion Trap Hybrid Mass Spectrometer. Anal. Chem. 2017, 89, 6358–6366. Copyright 2017 American Chemical Society. Adapted with permission from Riley, N. M.; Hebert, A. S.; Westphall, M. S.; Coon, J. J. Capturing Site-Specific Heterogeneity with Large-Scale N-Glycoproteome Analysis. Nat. Commun. 2019, 10, 1–13. Copyright 2019 Springer Nature.

