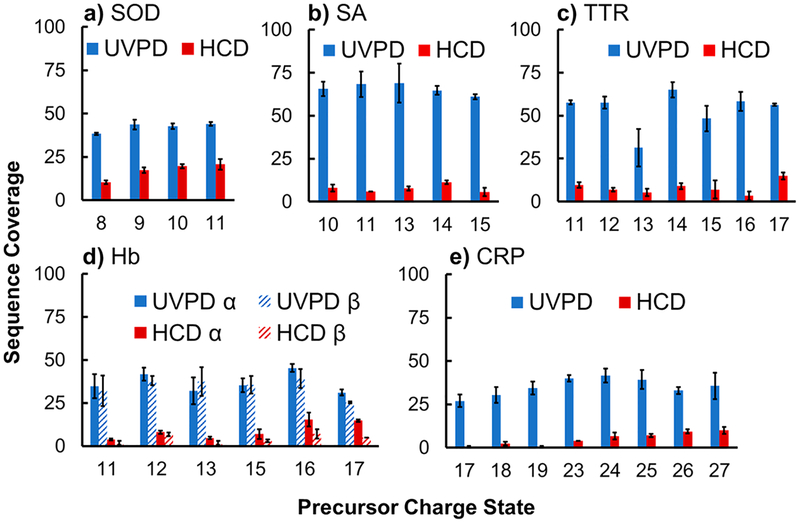
Figure 9.
Percent sequence coverage of all of the charge states generated from supercharging, standard, and charge-reducing solutions for (a) superoxide dismutase (SOD), (b) streptavidin (SA), (c) transthyretin (TTR), (d) hemoglobin (Hb), and (e) C-reactive protein (CRP). A single pulse of 3 mJ was used for all UVPD measurements. HCD energy was optimized for each protein and ranged from 1400 to 2500 eV of lab frame collision energy. Error bars are equal to the standard deviation of replicate data. Charge states with insufficient abundances for MS/MS analysis are not included.289 Reprinted with permission from Sipe, S. N.; Brodbelt, J. S. Impact of Charge State on 193 nm Ultraviolet Photodissociation of Protein Complexes. Phys. Chem. Chem. Phys. 2019, 21, 9265–9276, with permission of The Royal Society of Chemistry.

