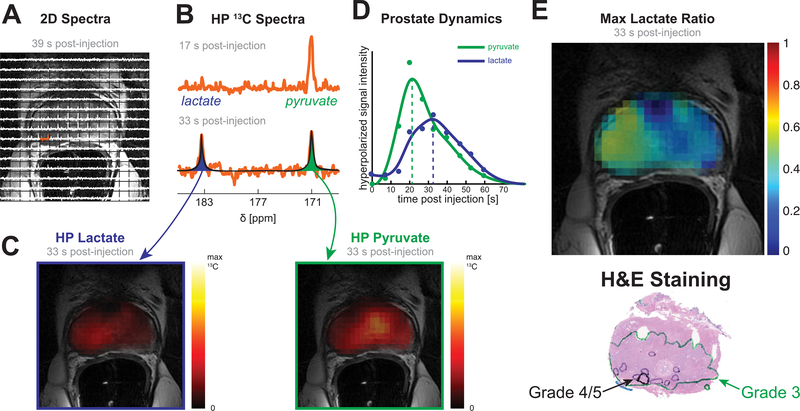
Figure 2. Data processing.
(A) Array of spectra overlaid on a T2-weighted image shows HP signal localized in the prostate. (B) Early and late spectra from one of the voxels in the right peripheral zone show pyruvate delivery and subsequent conversion to lactate. (C) Spectra are automatically fit with Lorentzian curves, which are used to calculate the area of the pyruvate and lactate peaks for each voxel (in space and time). (D) Pyruvate and lactate curves for the whole prostate show delivery of pyruvate and its conversion to lactate. (E) The maximum lactate to total carbon ratio (Lacmax) is shown and was used as the primary metric for analysis. A pathologist marked regions of Primary Gleason grades 3 and 4/5 on histology slides.

