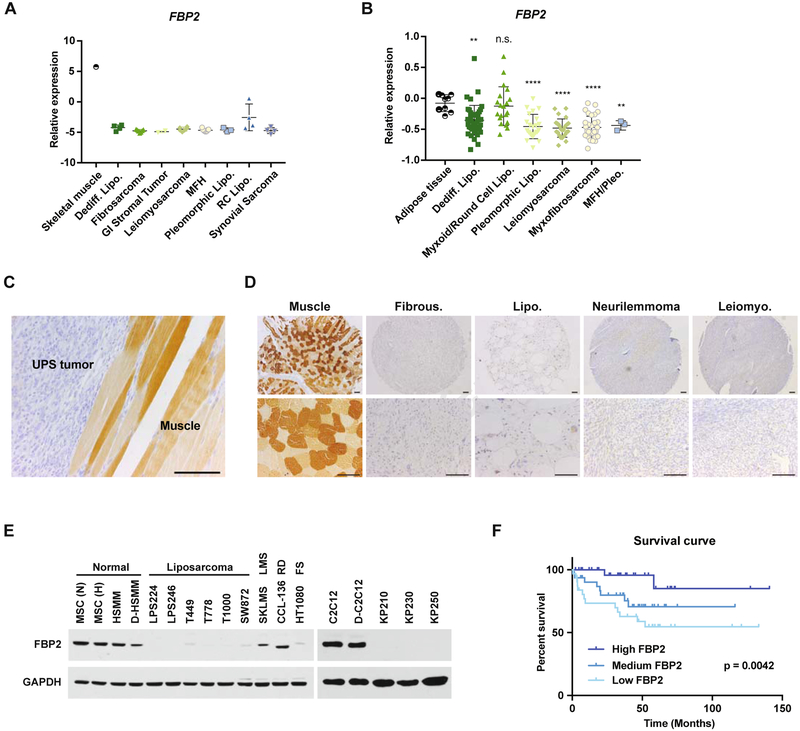
Figure 1. FBP2 is severely downregulated in a variety of sarcomas. Also see Figure S1 and S2.
(A and B) FBP2 mRNA expression from Oncomine analysis of the (A) Detwiller et al. and (B) Barretina et al. sarcoma patient samples data set (Barretina et al., 2010; Detwiller et al., 2005). Values are normalized to median-centered intensity and shown on a log2 scale. Abbreviations: dediff. lipo., dedifferentiated liposarcoma; MFH, malignant fibrous histiocytoma; MFH/Pleo., UPS; pleomorphic lipo., pleomorphic liposarcoma; RC lipo., round cell liposarcoma. *p < 0.05, **p < 0.01, ***p < 0.001, ****p < 0.0001; n.s., not significant.
(C) Representative immunohistochemical (IHC) FBP2 staining in mouse UPS tumor and surrounding muscle. Scale bars: 100 μm.
(D) Representative IHC FBP2 staining in human muscle and sarcoma samples from human sarcoma tissue array, including fibrous histiocytoma, liposarcoma, neurilemmoma, and leiomyosarcoma. Scale bars: 100 μm.
(E) Immunoblot analysis of FBP2 protein level in various human (left) and mouse (right) sarcoma cell lines. MSC, HSMM and C2C12 served as normal control. MSC, mesenchymal stem cell; HSMM, human skeletal muscle myoblast; (N), normoxia; (H) hypoxia; D-, differentiated; LMS, leiomyosarcoma; RD, rhabdomyosarcoma; FS, fibrosarcoma. GAPDH served as loading control.
(F) Kaplan–Meier curve of overall survival of liposarcoma patients from the Gobble et al. data set (Gobble et al., 2011), segregated into the top 33% FBP2 expression (High FBP2, n = 32), middle 33% FBP2 expression (Medium FBP2, n = 32), and bottom FBP2 expression (Low FBP2, n = 32). The p-value was calculated using a log-rank (Mantel–Cox) test.

