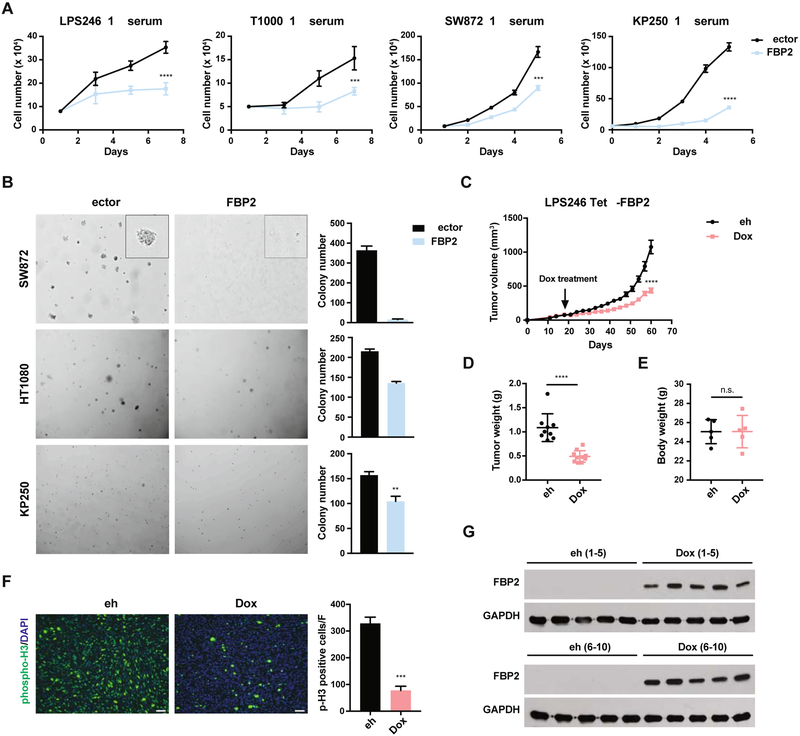
Figure 2. FBP2 re-expression inhibits sarcoma cell proliferation and xenograft tumor growth. Also see Figure S3.
(A) Growth of LPS246, T1000, SW872, and KP250 cells in low serum medium (1% FBS), with or without ectopic FBP2 expression. n = 3, *p < 0.05, **p < 0.01, ***p < 0.001, ****p < 0.0001.
(B) Soft agar colony formation assay of SW872, HT1080, and KP250 cells with or without FBP2 expression. Representative pictures of colony size (left) and quantification of colony number (right). Error bars represent SD of three replicate wells for each condition. *p < 0.05, **p < 0.01, ***p < 0.001, ****p < 0.0001.
(C) Tumor volume of LPS246 TetO-FBP2 liposarcoma xenografts with or without dox-induced FBP2 expression (each group includes ten tumors from five mice). ****p < 0.0001.
(D and E) LPS246 xenograft tumor weight (D) and body weight (E) with or without dox treatment at time of euthanasia, measured in grams. ****p < 0.0001, n.s., not significant.
(F) Representative image (left) of immunofluorescent staining of phosphor-Histone 3 and quantifications (right) in xenograft tumors with or without dox treatment. Five fields per slide were quantified. Scale bars: 100 μm.
(G) FBP2 induction in xenograft tumors were validated by western blot. GAPDH served as loading control.

