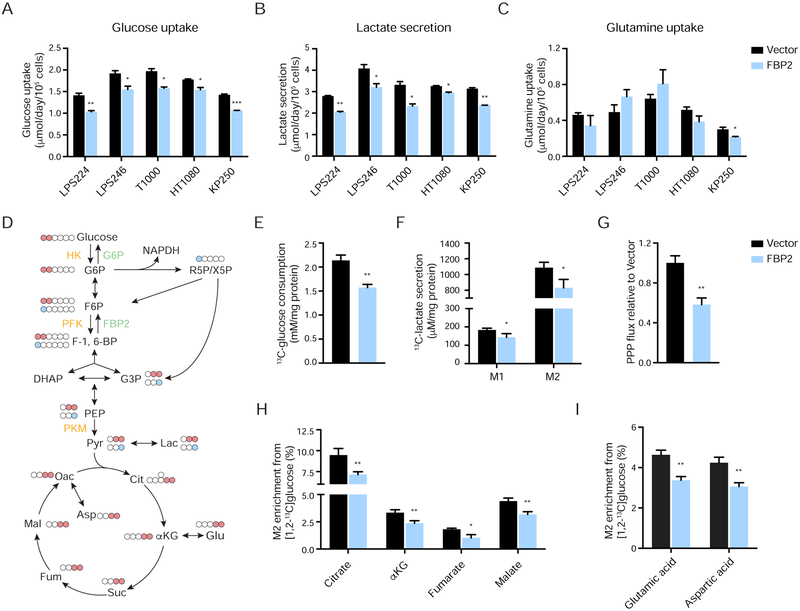
Figure 3. FBP2 restoration opposes glycolysis. Also see Figure S4.
(A–C) Glucose uptake (A), lactate secretion (B), and glutamine uptake (C) were assessed in LPS224, LPS246, T1000, HT1080, and KP250 cells with or without FBP2 re-expression by YSI bioanalyzer.
(D) Carbon fate map showing the isotopomer distribution of indicated metabolites derived from [1,2-13C]glucose. 13C atoms are depicted as filled circles. 13C atoms directly going through the glycolytic pathway are colored in red, while 13C atoms going through the PPP and recycled back to glycolysis are colored in blue.
(E and F) [1,2-13C]glucose consumption (E), M1 and M2 isotopomer distribution of lactate (F) measured from culture medium of LPS246 cells expressing vector control or FBP2.
(G) Calculated PPP flux (relative to vector control) in LPS246 cells with or without FBP2 expression based on the M1 to M2 13C-lactate ratio in cell extracts.
(H and I) M2 isotopomer distribution of indicated TCA metabolites (H) and amino acids (I) in LPS246 cells with or without FBP2 re-expression, labelled with [1,2-13C]glucose. M2 enrichment represents the mole per cent excess of M2 species above natural abundance. αKG, α-ketoglutarate.
Values represent mean ± SD of three experimental replicates. *p < 0.05, **p < 0.01, ***p < 0.001.

