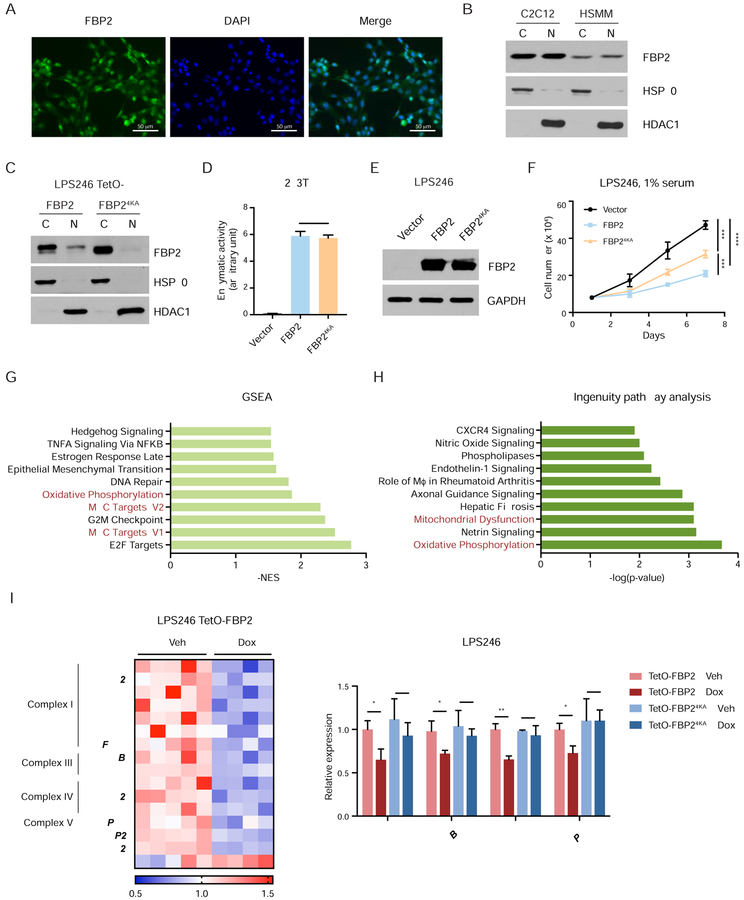
Figure 4. Nuclear FBP2 inhibits mitochondrial gene expression. Also see Figure S5.
(A) Immunofluorescent staining of mouse myoblast C2C12 cells with FBP2 antibody. Asterisks indicate representative sites with nuclear FBP2. DAPI is a fluorescent nuclear dye.
(B) FBP2 protein levels detected in cytosolic and nuclear fractions of C2C12 and HSMM. HSP90, a cytosolic protein, and HDAC1, a nuclear protein, reflect the purity of respective subcellular fractionations.
(C) Western blot analysis of V5-tagged FBP2 or FBP24KA (4 lysines in nuclear localization sequence were substituted with alanine) in the cytosolic and nuclear fractions of transfected LPS246 cells.
(D) Enzymatic activity of FBP2 in 293T cells expressing control vector, wild-type FBP2 and FBP24KA.
(E) Protein levels of ectopically expressed FBP2 and FBP24KA mutant in LPS246 cells. GAPDH serves as a loading control.
(F) Growth of vector control, FBP2- or FBP24KA-expressing LPS246 cells in 1% serum medium.
(G) GSEA comparing vehicle-treated (n = 5) and dox-treated (n = 4) LPS246 TetO-FBP2 cells. The 50-gene “Hallmark signatures” set from MsigDB was queried. Top 10 gene sets downregulated in dox-treated groups are shown with the normalized enrichment score (NES). Relevant gene sets are highlighted with red.
(H) Differentially expressed genes were analyzed using ingenuity pathway analysis (IPA) software. Top 10 relevant and significant biological pathways were identified according to p-value from Fisher’s exact test.
(I) Heatmap showing the relative expression of OXPHOS genes and mitochondrial dysfunction pathway from IPA. Expression signals are depicted using pseudocoloring, in which expression for each gene is shown as high (red) or low (blue).
(J) qRT-PCR analysis of MT-ND1, MT-CYB, MT-CO1, and MT-ATP6 in LPS246 cells constitutively expressing TetO-FBP2 or Tet-FBP24KA, treated with vehicle or dox.
Error bars represent SD of three experimental replicates. *p < 0.05, **p < 0.01, ***p < 0.001, ****p < 0.0001. n.s., not significant.

