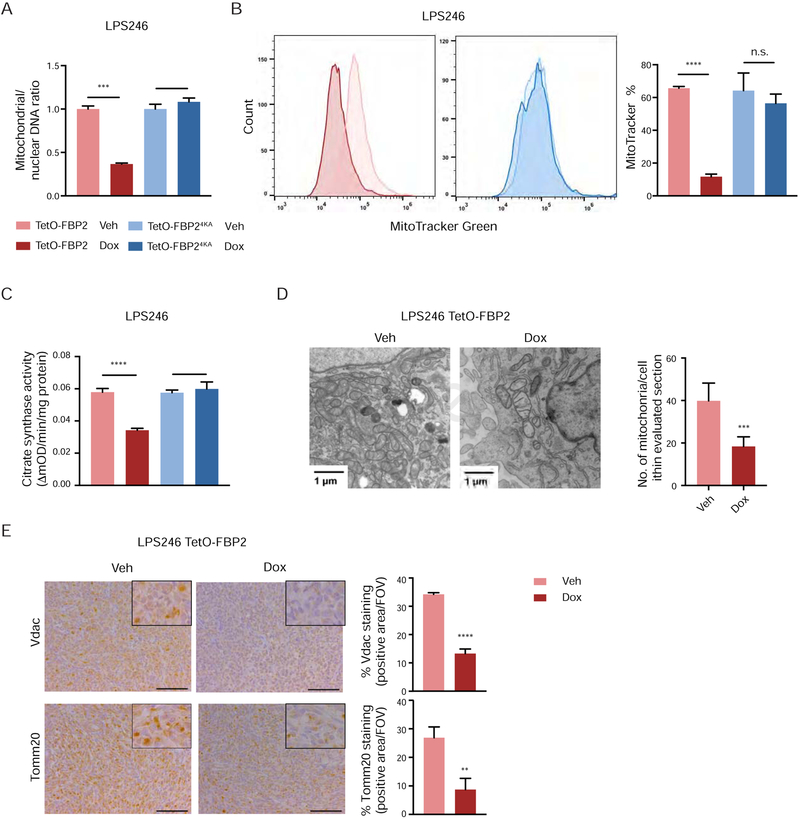
Figure 5. Nuclear FBP2 impairs mitochondrial biogenesis.
(A) qPCR analysis of mitochondrial (MT-ND1) versus nuclear (β-globin) DNA content in indicated cells (three experimental replicates).
(B) LPS246 TetO-FBP2 cells and TetO-FBP24KA cells stained with MitoTracker Green FM probe. Flow cytometry plots (left) show the fluorescence intensity corresponding to mitochondrial mass. Histograms (right) show the quantification (three experimental replicates).
(C) Citrate synthase activity, served as a marker for mitochondrial content, was measured in indicated cells (three experimental replicates).
(D) Ultrastructural analysis of mitochondria in LPS246 Teto-FBP2 cells using transmission electron microscopy (TEM). Scale bars: 1 μm. Quantification of the number of mitochondria per cell in the imaged section (vehicle treated, n = 10 cells; dox treated, n = 10 cells).
(E) Immunohistochemical staining for expression of voltage-dependent anion channel (Vdac) and Tomm20 on sections from LPS246 TetO-FBP2 xenografts treated with vehicle or dox. Five fields per slide were quantified. Scale bars: 100 μm.
Data are represented as mean ± SD. *p < 0.05, **p < 0.01, ***p < 0.001, ****p < 0.0001. n.s., not significant.

