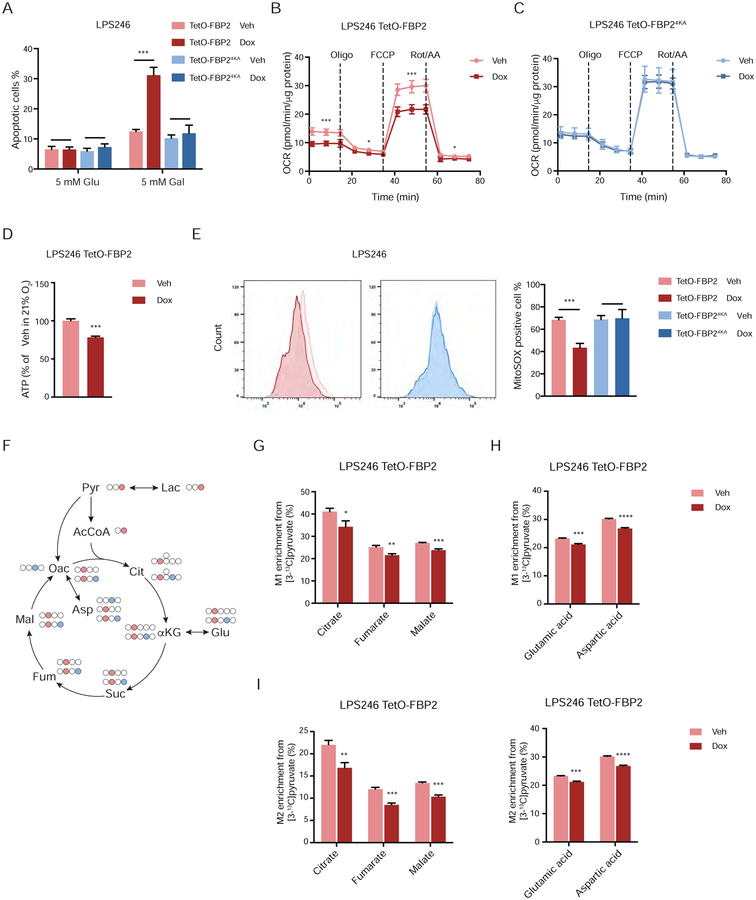
Figure 6. FBP2 suppresses mitochondrial respiration. Also see Figure S6.
(A) LPS246 cells cultured in 5 mM glucose and 5 mM galactose medium. Apoptotic cells measured through Annexin V/PI staining followed by flow cytometry.
(B and C) Relative oxygen consumption rate normalized to protein abundance in LPS246 TetO-FBP2 cells (B) or LPS246 TetO-FBP24KA cells (C) treated with vehicle or dox. Data are presented as mean ± SD of three reading cycles of n = 9 wells pooled from three independent experiments.
(D) ATP production was measured in indicated cells.
(E) Fluorescence intensity of MitoSOX analyzed by flow cytometry. Flow cytometry plots (left) show the fluorescence intensity. Histograms (right) display their quantification (three experimental replicates).
(F) Carbon fate map showing the isotopomer distribution of indicated metabolites derived from [3-13C]pyruvate. 13C atoms are depicted as filled circles. 13C atoms directly going through the acetyl-CoA are colored in red, while 13C atoms going through oxaloacetate and combined with acety-CoA to generate citrate are colored in blue.
(G–J) M1 isotopomer distribution of indicated TCA metabolites (G) and amino acids (H), and M2 isotopomer distribution of indicated TCA metabolites (I) and amino acids (J) in LPS246 TetO-FBP2 cells with vehicle or dox treatment, labelled with [3-13C]pyruvate.
Error bars represent SD of three experimental replicates except in B and C. *p < 0.05, **p < 0.01, ***p < 0.001, ****p < 0.0001. n.s., not significant.

