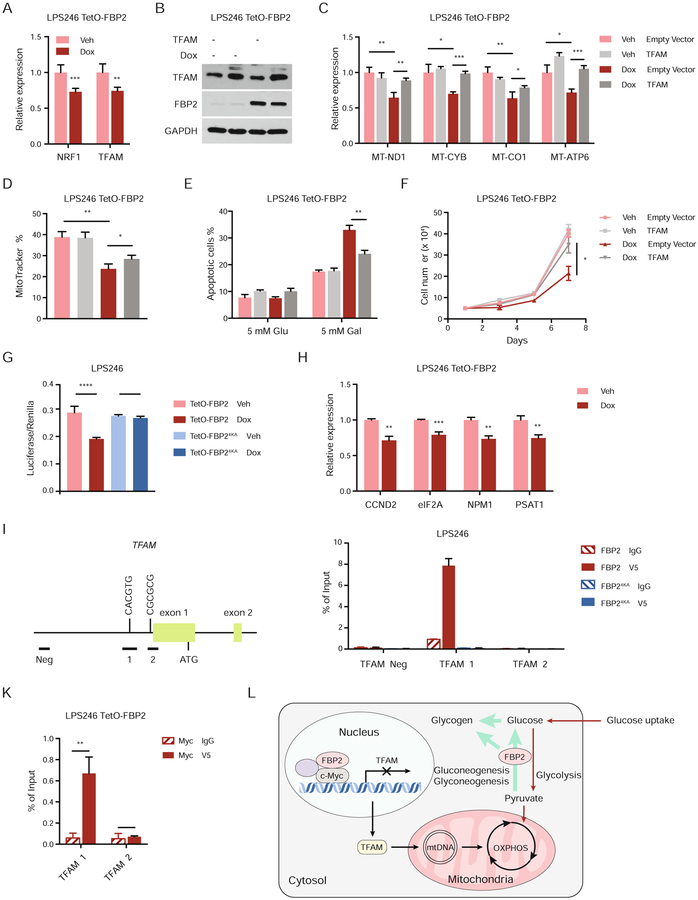
Figure 7. FBP2 transcriptionally represses mitochondrial biogenesis. Also see Figure S7.
(A) qRT–PCR analysis of NRF1 and TFAM in vehicle treated or dox-treated LPS246 TetO-FBP2 cells.
(B) Immunoblot analysis for ectopic expression of vector control or TFAM in LPS246 TetO-FBP2 cells.
(C) qRT-PCR analysis of MT-ND1, MT-CYB, MT-CO1, and MT-ATP6 in indicated cells.
(D) LPS246 TetO-FBP2 cells with or without TFAM expression stained with MitoTracker Green FM probe. Fluorescence intensity corresponding to mitochondrial mass is shown in histograms.
(E) Indicated cells cultured in 5 mM glucose and 5 mM galactose medium, where apoptotic cells were measured through Annexin V/PI staining followed by flow cytometry.
(F) Growth of indicated cells in low serum medium (1% FBS).
(G) c-Myc reporter activity measured in LPS246 TetO-FBP2/FBP24KA cells transfected with Myc/Max luciferase reporter, in the presence of vehicle or dox. Transfection efficiencies were normalized to co-transfected pRenilla-luciferase.
(H) qRT-PCR analysis of c-Myc target genes (CCND2, eIF2A, NPM1, PSAT1) in indicated cells.
(I) Diagram of 2 kb upstream of exon 1 to exon 2 of human TFAM. Exons are represented by green boxes. The E box in amplicon 1 is illustrated. Horizontal bars labeled Neg, 1, 2 indicate the regions amplified for ChIP analysis.
(J) ChIP assays evaluating FBP2 association with chromatin at a c-Myc binding site in TFAM promoter (amplicon 1 and 2), or to a site negative for c-Myc binding (amplicon Neg). IgG, isotype-matched immunoglobulin G; V5, V5-tagged FBP2.
(K) ChIP-reChIP analysis examining the co-localization of c-Myc and FBP2 at amplicon 1 and 2 at TFAM promoters.
(L) Model depicting the metabolic status, transcription activity and mitochondrial change of sarcoma cells upon FBP2 re-expression.
Data are represented as mean ± SD (three experimental replicates) except in J and K, which indicate standard error of the mean (three technical replicates from a representative experiment). *p < 0.05, **p < 0.01, ***p < 0.001, ****p < 0.0001. n.s., not significant.

