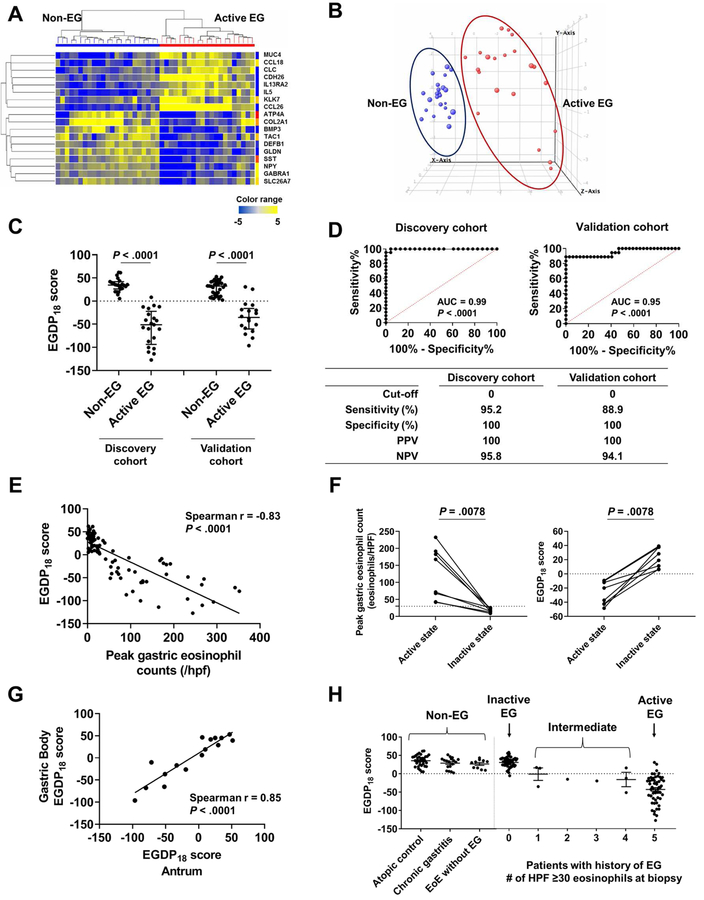
FIG 2. Development of tissue-based platform (EGDP) and EGDP18 score on the basis of differentially expressed genes.
A, Heat map (yellow, upregulated; blue, downregulated) based on the 18 core genes (FDR P < .01 and fold change ≥10-fold change) in the discovery cohort. B, Three-dimensional presentation by PCA between samples on the basis of the 18 core genes (blue, non-EG controls; red, patients with EG). C, Comparison of the EGDP18 score between EG and non-EG in discovery and validation cohort. D, ROC curve analysis showing the utility of the EGDP18 score for the diagnosis of EG. E, Correlation between peak gastric eosinophil counts and EGDP18 score. F, Longitudinal changes of peak gastric eosinophil counts and EGDP18 score in patients with EG at active and inactive state. G, Correlation of EGDP18 score between the gastric antrum and body mucosa from the same subjects. H, EGDP18 score as a function of different patient groups, including patients with EG with involvement of 1–5 HPFs. AUC; area under the curve; EG, eosinophilic gastritis; EGDP, eosinophilic gastritis diagnostic panel; FDR, false-discovery rate; HPF, high-power field; NPV, negative predictive value; PCA, principal component analysis; PPV, positive predictive value; ROC, receiver operating characteristic.

