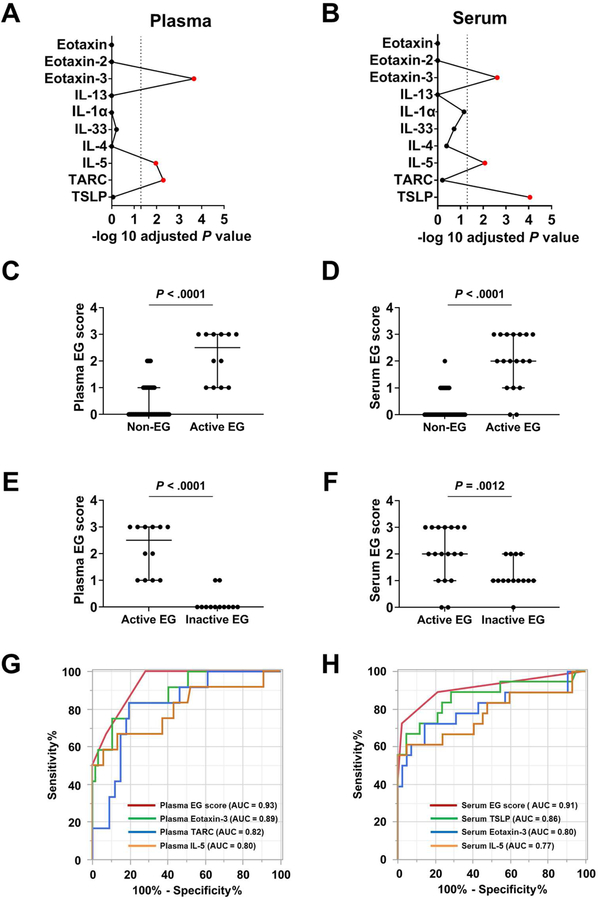
FIG 4. Development of blood-based platforms via a multiplex protein array.
A and B, Among the 10 biomarkers embedded in the platform, a statistical screening was performed between the non-EG subjects and patients with EG in the (A) plasma and (B) serum cohort, separately, resulting in 3 biomarkers (red) with adjusted P < .05 (Bonferroni correction). C and D, Levels of blood EG scores in patients with active EG (C, plasma; D, serum). E and F, Blood EG scores in patients with active EG and inactive EG (E, plasma; F, serum). G and H, ROC curves and performance of blood EG scores. The AUC was calculated for 4 conditions: (G) Plasma cohort; plasma EG score, eotaxin-3, IL-5, and TARC. (H) Serum cohort; serum EG score, eotaxin-3, IL-5, and TSLP. AUC; area under the curve; EG, eosinophilic gastritis; NPV, negative predictive value; PCA, principal component analysis; PPV, positive predictive value; ROC, receiver operating characteristic.

