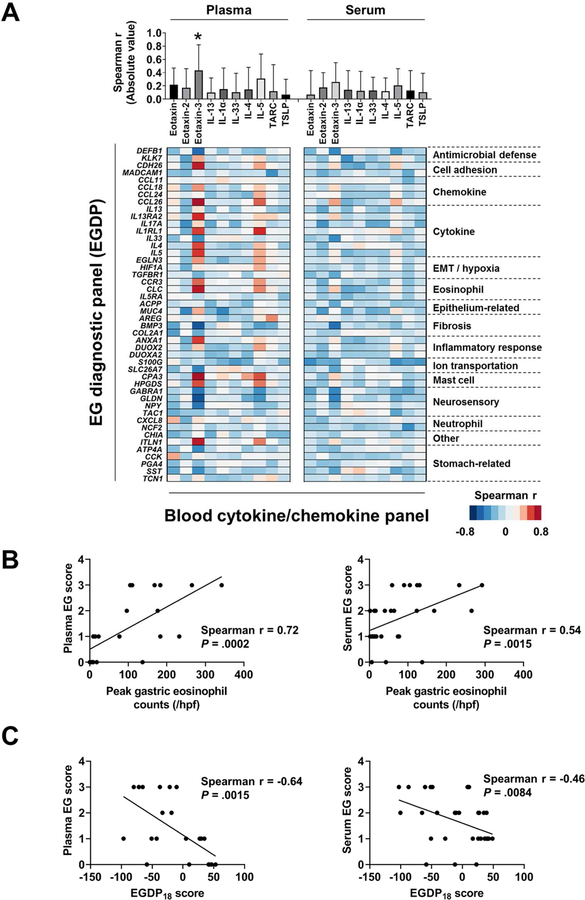
FIG 5. Associations among the local and systemic features.
A, Associations between the EGDP and the blood cytokine/chemokines. Using Spearman r for the correlation between the EGDP gene expressions and (left) plasma and (right) serum cytokine/chemokines, the magnitudes of correlation with the EGDP are shown (upper). A Spearman r–based heat diagram for the correlation at the gene level are shown ( lower). Genes shown on the y axis are organized within functional groupings. Darker red shades indicate stronger positive correlations, whereas darker blue shades indicate stronger negative correlations. B, Correlation between blood EG score (left, plasma; right, serum) and peak gastric eosinophil counts, with Spearman r and P values shown. C, Correlation between blood EG scores (left, plasma; right, serum) and the EGDP18 score, with Spearman r and P values shown. EG, eosinophilic gastritis; EGDP, eosinophilic gastritis diagnostic panel; EMT, epithelial-mesenchymal transition; HPF, high-power field. *P < .01 vs. all other proteins.

