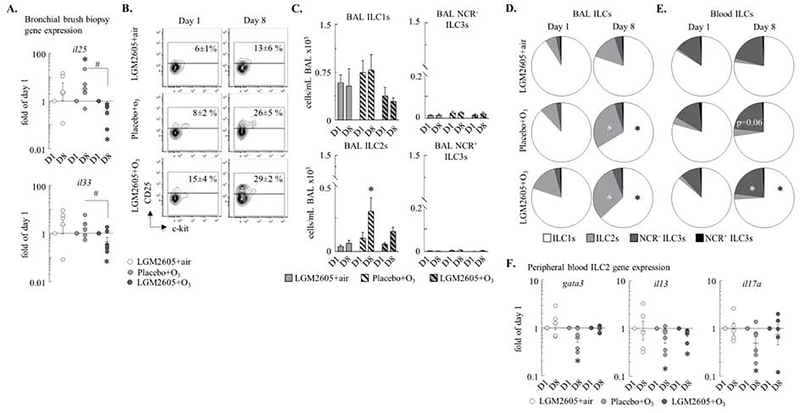
Figure 3. O3 increased ILC2 count in the BAL and NCR− ILC3 count in the peripheral blood.
(A) RNA was extracted from bronchial brush biopsies, and expression of the il25 and il33 genes were measured by qPCR. ΔΔCt (gapdh and rpl32), fold of the baseline/day 1 values in each individual monkey. (B) Blood and BAL ILCs: live CD90+Lineage−CD127+ cells. ILC2s: CD25+c-kitvar ILCs. Numbers show mean±SEM of the % of ILCs that were CD25+ (ILC2s). (C) ILC1s, ILC2s, NCR− ILC3s, and NCR+ ILC3s were quantified (cells/mL BAL ×103). ILC1s: c-kit−NKp44− ILCs; NCR+ ILC3s: NKp44+c-kit+ ILCs; NCR− ILC3s: NKp44−c-kit+ ILCs. (D-E) Pie charts: the relative proportions of the ILC subsets on day 1 and day 8. (F) RNA was extracted from blood ILC2s (live Lineage−CD90+CD25+c-kitvar cells) and expression of gata3, il13, and il17a was measured by qPCR. ΔΔCt (gapdh), expressed as fold of baseline/day 1; each macaque served as its own control. Mean±SEM of n=5–6; *p<0.05 (within groups: day 1 vs. day 8; A, D-F: Student’s paired t-test; C: Two-way ANOVA); #p<0.05 (between groups, Two-way ANOVA).

