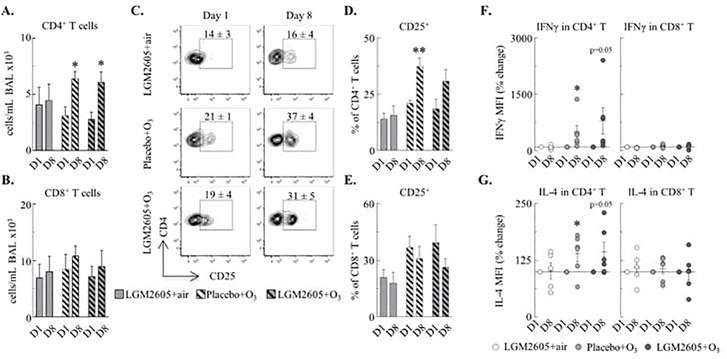
Figure 5. O3 activated BAL CD4+ T cells.
(A-B) CD4+ T cells (live CD45+CD3+CD4+CD8− cells) and CD8+ T cells (live CD45+CD3+CD4−CD8+ cells) were quantified (cells/mL BAL ×103). (C-E) Proportion of CD4+ and CD8+ T cells that were CD25+ (mean±SEM in flow plots and bar graphs). (F-G) IFNγ and IL-4 expression (MFI) was measured in CD4+ and CD8+ T cells (% of day 1; each macaque served as its own control). Mean±SEM of n=5–6; *p<0.05, **p<0.01 (within groups: day 1 vs. day 8, F-G: Student’s paired t-test; A-E: Two-way ANOVA).

