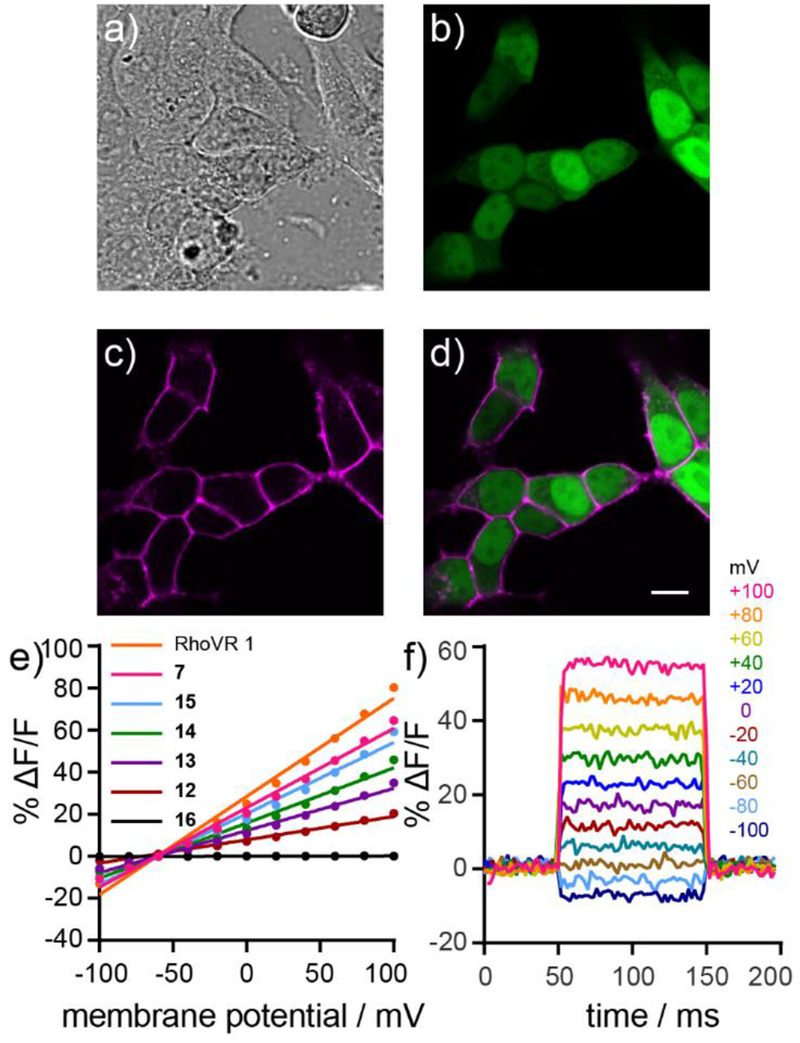
Figure 2.
Cellular labeling and voltage sensitivity of RhoVR1-PEGx-Halo compounds. a) DIC image of HEK293T cells expressing nuclear EGFP stained with 15. b) Confocal fluorescence image of HaloTag expressing cells from (a) as indicated by nuclear EGFP fluorescence. c) Confocal fluorescence image showing the fluorescence of 15 from cells in (a). d) Merge of fluorescence from EGFP (green) and 15 (magenta), demonstrating the highly selective localization of 15 to HaloTag expressing cells. Scale bar is 10 μm. e) Plot of % ΔF/F vs final membrane potential for RhoVR 1, 7 and RhoVR1-PEGx-Halo derivatives 12–16 (n=3-9, error bars not shown). f) Plot of the fractional change in fluorescence of 15 vs time for 100 ms hyper- and depolarizing steps (±100 mV in 20 mV increments) from a holding potential of −60 mV for single HEK293T cells under whole-cell voltage clamp mode.

