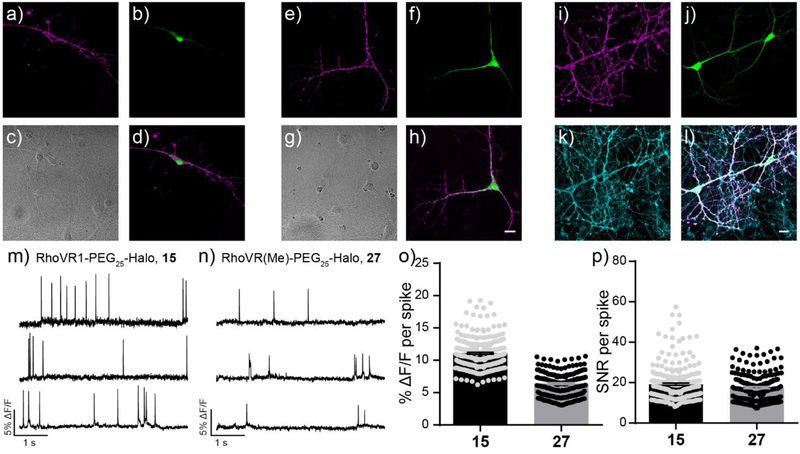
Figure 3.
Evaluation of RhoVR-Halos 15 and 27 in cultured rat hippocampal neurons. Confocal fluorescence microscopy images (single optical section of ~0.8 μm) depicting the selective labeling of HaloTag expressing neurons with (a-d) 15 or (e-h) 27. a and e) RhoVR fluorescence is localized to the plasma membrane of the HaloTag expressing neurons. b and f) EGFP fluorescence indicates expression of HaloTag (pDisplay). c and g) DIC image and d and h) merged image of neurons in panels (a/b) and (e/f). Scale bar is 20 μm. i) Maximum projection of RhoVR-Halo 27 fluorescence in j) HaloTag and EGFP-expressing neurons. k) Counter-staining with silicon-rhodamine BeRST reveals pan-membrane staining. 1) Merged image showing RhoVR (magenta), EGFP (green), and BeRST (cyan) fluorescence. Scale bar is 20 μm. Plots of fractional change in fluorescence (ΔF/F) vs time in hippocampal neurons stained with m) 15 or n) 27. o) Average ΔF/F and p) SNR per spike for evoked action potentials recorded with RhoVR-Halos. Error bars are ±S.E.M. for n = 256 or 186 spikes from 30 or 21 neurons for RhoVR1-PEG25-Halo (15) or RhoVR(Me)-PEG25-Halo (27), respectively.

