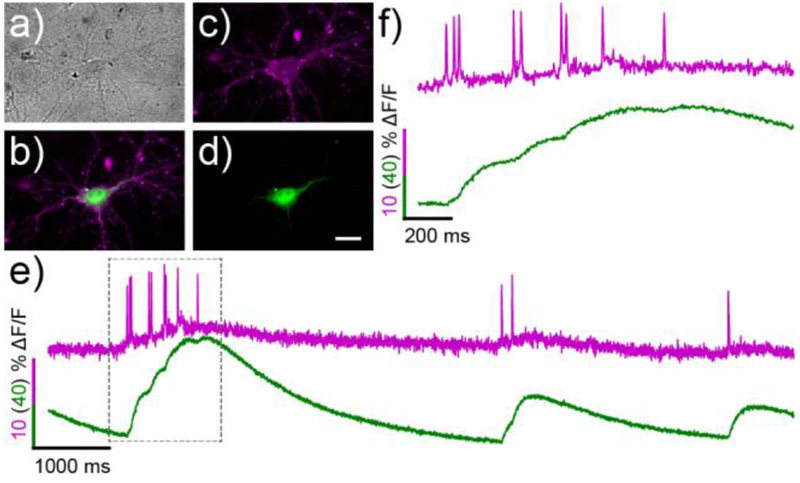
Figure 4.
Simultaneous, two-color voltage and Ca2+ imaging in hippocampal neurons with RhoVR-Halo 15 and GCaMP6s. a) Transmitted light image of neurons expressing cell-surface HaloTag and cytosolic GCaMP6s. b) Merged widefield fluorescence microscopy image depicting 15 (magenta) and GCaMP6s (green) staining. Individual channels of the same neuron show c) membrane-associated 15 and d) cytosolic GCaMP6s. e) Plot of ΔF/F vs time for 15 (magenta) and GCaMP6s (green). f) Expanded time scale of the boxed region in panel (e). Scale bar is 20 μm.

