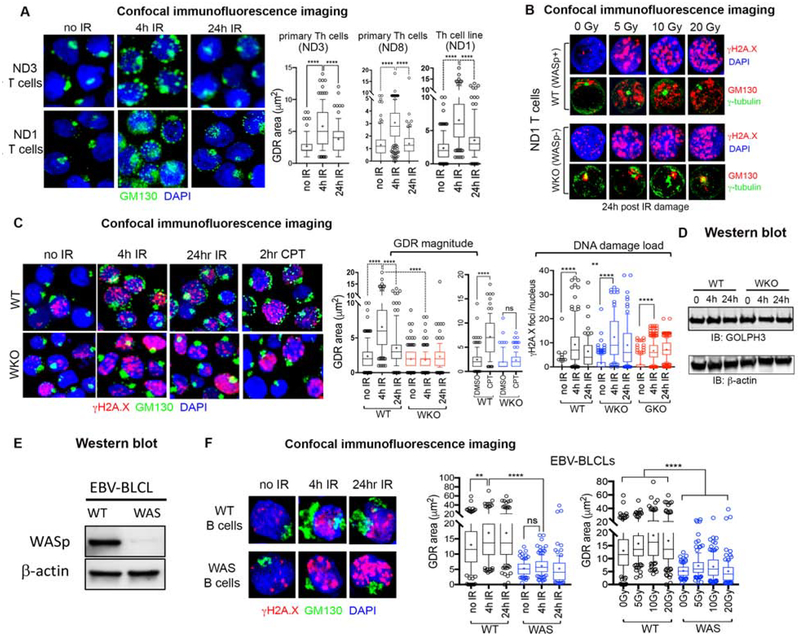
Figure 2. WASp is required to generate the DNA damage-induced Golgi dispersal response in Th and B cells.
(A) Confocal immunofluorescence images of the human Th cells (wild-type, WT) from normal donors (WASp-sufficient) dual-labelled with the indicated reagents at 4h and 24hr after 5Gy X-Ray treatment, or no X-Ray control. Displayed images are the collapsed composites of 20–30 z-stack images acquired at x63 magnification, and are representative of at least 100 cells for each sample. Box-and-whisker plots (whiskers@10–90%, horizontal bar denotes median, “+” denotes mean) generated from 3D (z-stack) images of at least n=100 cells from n=3 independent experiments for each biological sample (ND1, ND3, ND8). p**** ≤ 0.0001, Mann-Whitney nonparametric. ND3 and ND8 are primary Th cells, ND1 is HTLV-1 immortalized Th cell line. (B) Confocal immunofluorescence images of the human Th cells, WT (WASp-sufficient) or WKO (WASp-deficient), isogenic pair from ND1 donor, triple-labelled with the indicated reagents at 24hr after 5Gy, 10Gy, and 20Gy X-Ray treatment, or no X-Ray (0 Gy) control. Displayed images, acquired at 24h post IR treatment, are collapsed composites of 20–30 z-stack images acquired at x63 magnification, and are representative of at least 100 cells for each cell type. (C) Confocal immunofluorescence images of the human Th cells, WT (WASp-sufficient) or WKO (WASp-deficient) triple-labelled with the indicated reagents after IR- or CPT-induced DNA damage. The accompanying box-and-whisker plots display the magnitude of GDR, induced by 5Gy IR or CPT, relative to the DNA damage load. Other descriptions of the images, plots, and p- values are as per panel A. Similar findings of impaired IR-induced GDR was captured also in WASp-deficient (WKD) ND8 Th cells relative to WT control (data not shown). (D) Western blot depicting GOLPH3 expression level relative to the loading control (β-actin) in the whole cell extracts of the indicated Th cells at the indicated times after 5Gy of IR treatment. GOLPH3-knock out (GKO) data is included in this panel to allow direct comparison of the DNA damage loads between WT, WKO and GKO T cells. The corresponding GKO T cell images are shown in Figure 4. (E) Western blot depicting WASp expression level relative to the loading control (β-actin) in the whole cell extracts of the indicated B cells, WT and WAS. (F) Confocal immunofluorescence images of the human B cells (EBV-immortalized), WT (WASp-sufficient, normal donor) or WAS (WASp-deficient, patient-derived) triple-labelled with the indicated reagents after IR treatment for the duration indicated. The accompanying box-and-whisker plots display the magnitude of GDR induced by IR at the set done of 5Gy (on left) and increasing IR doses (on the right). p- values per Mann-Whitney nonparametric ****<0.0001, **<0.001, ns: nonsignificant. Other descriptions of the images and plots as per panel A.

