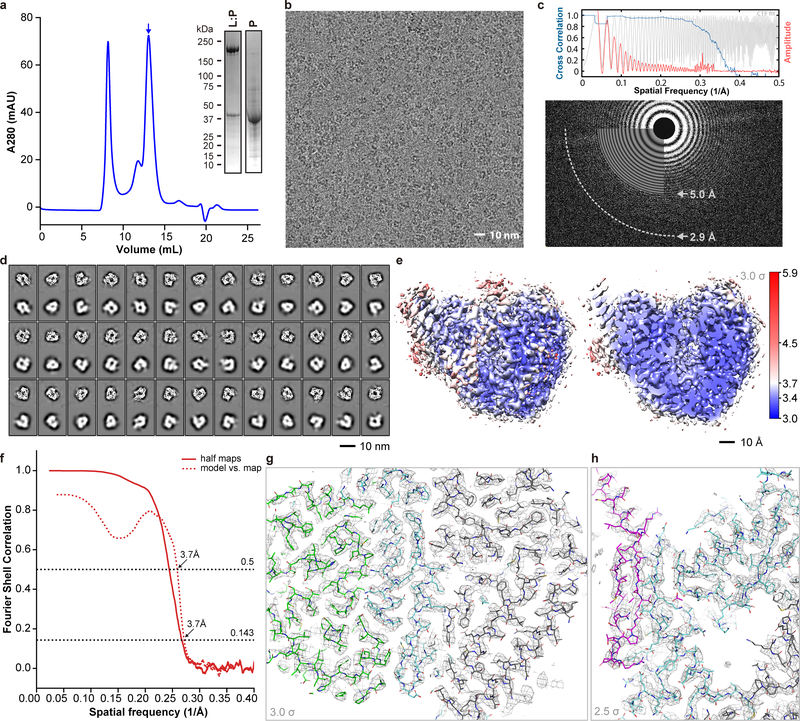
Extended Data Fig. 1 |. Purification of HMPV L:P and structure determination using cryo-EM.
a, Representative size exclusion chromatogram of the L:P complex (these experiments were repeated more than 5 times). Fractions indicated by an arrow were collected and concentrated to 0.85 mg/mL and used for cryo EM analysis. Inset: SDS PAGE followed by Coomassie blue staining of the purified samples. Also shown: free P protein separated from L:P complex by heparin chromatography (For gel source data, see Supplementary Fig. 1). b, Raw micrograph of HMPV-L:P particles recorded in vitreous ice. Scale bar 10 nm. c, Power spectrum of the image shown in panel (b). We limited the high resolution for fitting to a spatial frequency of 1/5.0 Å and 1/2.9 Å marks the highest spacing to which CTF rings were successfully fit. d, 2D classes and “self-consistency check” for the cryo-EM 3D reconstruction. In each box over the three rows, the upper panel shows one 2D class average, whilst the lower panel shows the corresponding projection from the initial 3D model. e, Local resolution of the cryo-EM density map. Variations in local resolution are color- coded from blue (3.0 Å) to red (5.9 Å), computed with Resmap.39 f, Fourier Shell Correlation (FSC) of the cryo-EM map as a function of the spatial frequency. The gold standard resolution is 3.7 Å based on the FSC=0.143 criterion, consistent with the model to map correlation (0.5 criterion). g, Example of the electron density map that allowed model building. The region shown is at an interface between the RdRp and capping domain. The map is shown as a gray mesh, contoured at a level of 3 σ. The atomic model is shown as sticks with residues from RdRp colored in cyan (NTD in grey) and in green for the capping domain. h, The region shown is the three-stranded β-sheet at the interface between the RdRp (cyan sticks) and the phosphoprotein (magenta sticks). The map is shown as a gray mesh, contoured at a level of 2.5 σ. We observed a nearly identical structure of the L:P complex in a reconstruction obtained by premixing the L:P complex with fully phosphorylated P, indicating that potential exchange of P affected neither the formation nor the structure of the L:P complex.

