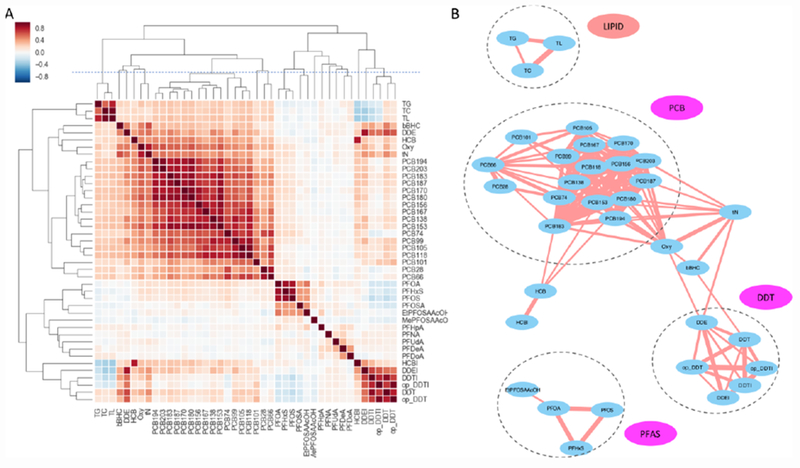
Figure 2. Exposure communities detected by quantitative correlations.

Each variable was measured in the CHDS cohort by conventional assays, either enzymatic or targeted mass spectrometry. (A) Unsupervised hierarchical clustering of exposure measurements, aside with several clinical variables, using Spearman correlation. (B) Communities detected among the variables from the correlation network, which was defined by all pairs of variables with Spearman correlation coefficient above 0.5. The result is similar to the clusters identified by the dendrogram (above the dashed line) in A.
