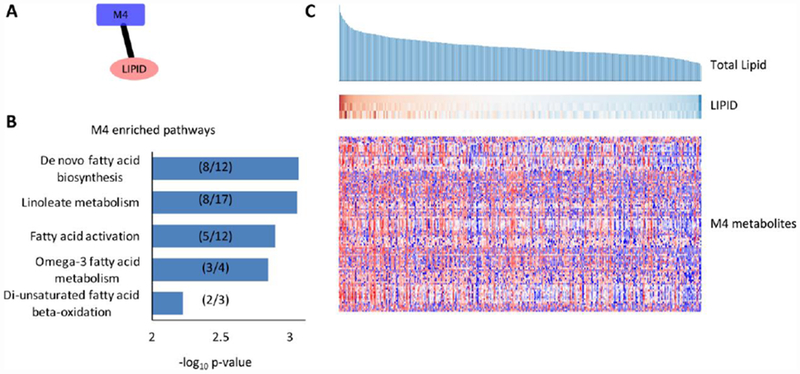
Figure 4. A metabolite community (M4) strongly associated with the lipid community.

(A) A representative association link taken from Figure 3. (B) The metabolite features in the M4 community were tested by the mummichog software for their pathway enrichment. Significantly enriched metabolic pathways are plotted by their significance (−log10(p-value)). The numbers in parentheses indicate the number of significant metabolites/the number of detected metabolites for each pathway. (C) Each column represents a study participant, sorted by their blood level of total lipid in descending order (top). The levels of the three members of the LIPID community are shown in the middle and the intensities of metabolites of the M4 community are shown in the bottom heatmap, whereas each row represents a feature. In all panels, each column is matched to the same participant
