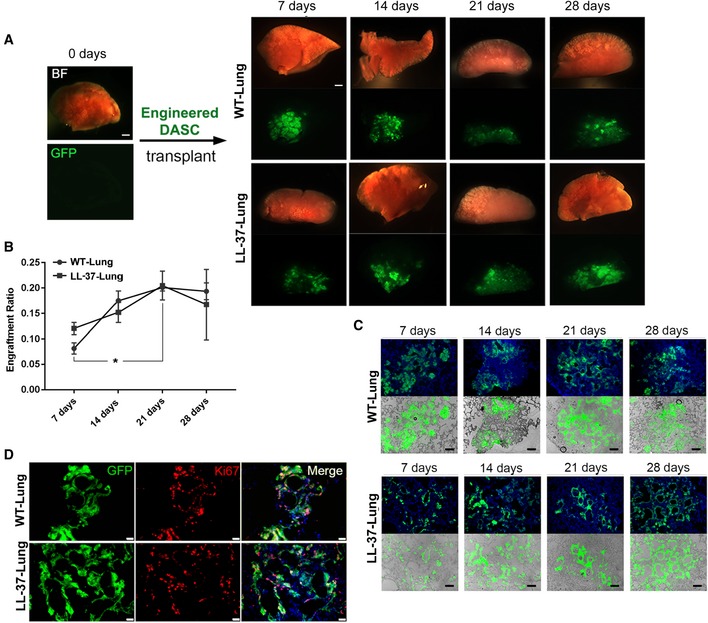
Figure 4. Lung engraftment of WT‐ and LL‐37‐mDASCs after orthotopic transplantation.

-
ABright‐field and direct fluorescence images of mouse lungs following transplantation of 1 × 10⁶ GFP‐labeled WT‐mDASCs (WT‐Lung) or LL‐37‐mDASCs (LL‐37‐Lung) on indicated days. Scale bar, 1,000 μm.
-
BEngraftment ratio of indicated cells in mouse lungs on indicated days. n = 3. Error bars, SEM. *P = 0.0474. Statistics: two‐way RM ANOVA followed by Tukey's test.
-
CMorphology of engrafted GFP‐labeled cells in lung parenchyma by direct fluorescence. Blue color indicates nucleus DAPI staining. Scale bar, 200 μm.
-
DAnti‐Ki67 immunofluorescence of engrafted GFP‐labeled WT‐ and LL‐37‐mDASCs in lung parenchyma 21 days after transplantation. Scale bar, 50 μm.
Source data are available online for this figure.
