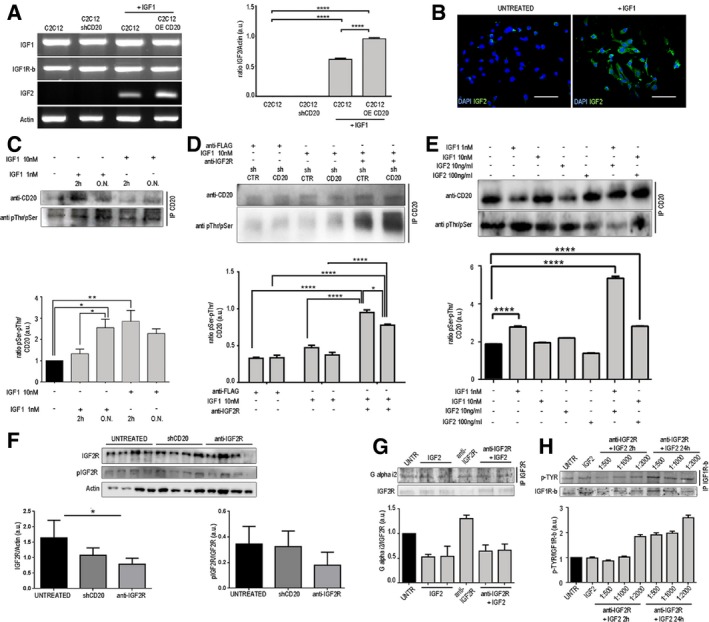
Figure 1. IGF2R blockade results in CD20 phosphorylation.

-
ART–PCR expression and quantification of IGF1, IGF1Rβ and IGF2 levels in untreated C2C12 and shCD20 C2C12 myoblasts and 10 nM IGF1‐treated C2C12 and over‐expressing CD20 C2C12 myoblasts. Each experiment was replicated independently four times. Two‐way ANOVA. ****P < 0.0001. All values are expressed as the mean ± SEM.
-
BImmunofluorescence for IGF2 (in green) in untreated and 10 nM IGF1‐treated C2C12 myoblasts. Scale bars = 75 μm.
-
C–ERepresentative CD20 immunoprecipitation using anti‐pSer + pThr in (C) C2C12 cells treated with IGF1 for 2 h or overnight (ON), (D) sh‐empty (shCTR)‐ and shCD20‐treated C2C12 cells treated with anti‐Flag and 10 nM anti‐IGF2R, (E) C2C12 cells treated with IGF1 and IGF2, as indicated. Densitometric analysis of data is expressed as the ratio of CD20/vinculin or pSer + pThr/CD20 and is shown normalized to vinculin in arbitrary units in the lower panels. Two‐way ANOVA. *P < 0.05; **P < 0.01; ****P < 0.0001. Each experiment was performed in triplicate wells. All values are expressed as the mean ± SEM.
-
FRepresentative WB of IGF2R and phosphorylated IGF2R (pIGF2R) in untreated, shCD20‐treated and anti‐IGF2R‐treated C2C12 cells. Densitometric analysis of data is expressed as the ratio of IGF2R/actin or pIGF2R/IGF2R in arbitrary units in the lower panels. One‐way ANOVA. *P < 0.05. Each experiment was performed in triplicate wells. All values are expressed as the mean ± SEM.
-
GIGF2R immunoprecipitation products were immunoblotted for Gαi2 and WB expression of IGF2R in untreated, IGF2‐treated, anti‐IGF2R‐treated and IGF2 + anti‐IGF2R‐treated C2C12 cells. Densitometric analysis of data is expressed as the ratio of Gαi2/IGF2R in arbitrary units in the lower panel. Each experiment was performed in triplicate wells. All values are expressed as the mean ± SEM.
-
HRepresentative WB of IGF1Rβ and IGF1Rβ immunoprecipitation products immunoblotted for pTyr in untreated, IGF2‐treated and IGF2 + anti‐IGF2R‐treated (1:500, 1:1,000 and 1:2,000 dilutions of anti‐IGF2R) C2C12 cells (cells were treated for 2 and 24 h). Densitometric analysis of data is expressed as the ratio of pTYR/IGF1Rβ in arbitrary units in the lower panel. Each experiment was performed in triplicate wells. All values are expressed as the mean ± SEM.
Source data are available online for this figure.
