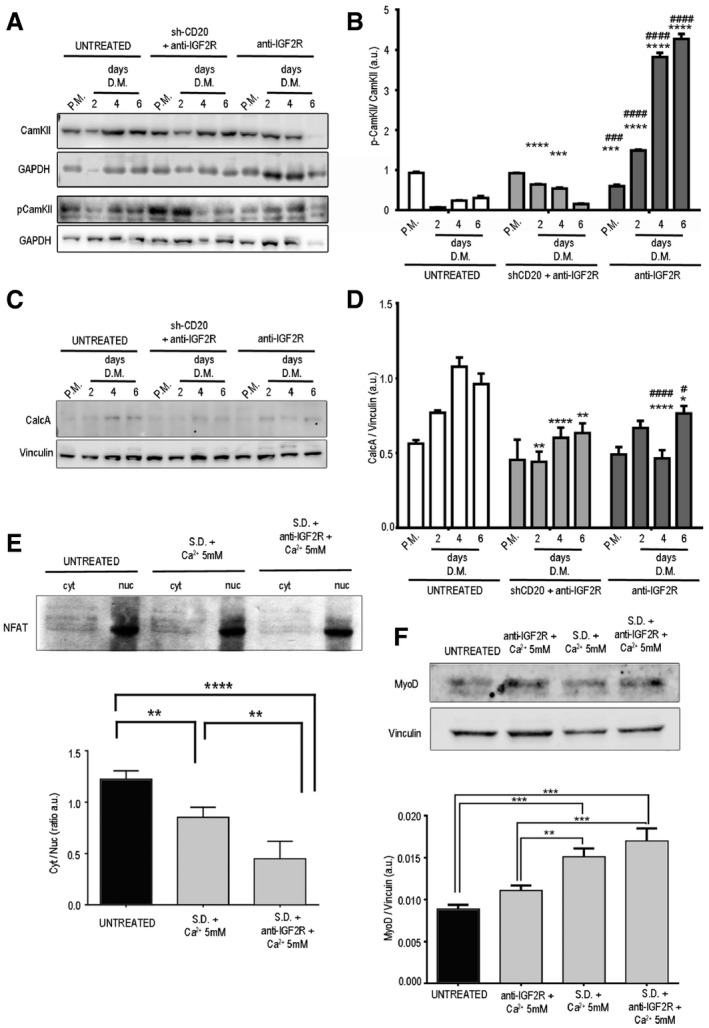
Figure EV2. Calcineurin signalling and NFAT activation in myoblasts treated with anti‐IGF2R.

- Representative WB analysis of CAMKII, pCAMKII and GAPDH levels in total protein lysates of untreated and anti‐IGF2R‐treated C2C12 cells and ShCD20 C2C12 myoblasts grown in proliferation medium (PM) after 2, 4 and 6 days of myogenic differentiation (DM).
- Densitometry analysis of data shown in panel (A) expressed as the ratio of pCAMKII/CAMKII in arbitrary units. Two‐way ANOVA test. ***P < 0.001; ****P < 0.0001 for the comparison with untreated cells at the corresponding time point. ### P < 0.001; #### P < 0.0001 for the comparison with C2C12 shCD20 cells at the corresponding time point. Each experiment was performed in triplicate wells. All values are expressed as the mean ± SEM.
- Representative WB analysis of CalcA and vinculin levels in total protein lysates of untreated and anti‐IGF2R‐treated C2C12 cells and ShCD20 C2C12 myoblasts grown in proliferation medium (PM) and collected after 2, 4 and 6 days of DM.
- Densitometry analysis of data shown in panel (C). Data are expressed as the ratio of CalcA/vinculin in arbitrary units. Two‐way ANOVA test. *P < 0.05; **P < 0.01; ****P < 0.0001 for the comparison with untreated cells at the corresponding time point. # P < 0.05; #### P < 0.0001 for the comparison with C2C12 shCD20 cells at the corresponding time point. Each experiment was performed in triplicate wells. All values are expressed as the mean ± SEM.
- SDS–PAGE gel and immunoblots showing NFAT expression in cytoplasmic and nuclear fractions of untreated and SD+ 5 mM Ca2+ and SD+ 5 mM Ca2++anti‐IGF2R treated C2C12 myoblasts. The image reveals that there was a decrease in the size of the band corresponding to pNFAT in the cytoplasmic samples obtained from SD+ 5 mM Ca2+ and SD+ 5 mM Ca2+ +anti‐IGF2R‐treated C2C12 myoblasts. The lower panel shows the quantification of the cytoplasmic/nuclear NFAT signal expressed as a ratio in arbitrary units. The decrease observed in these experiments confirmed the increase in the nuclear localization of NFAT caused by its diminished cytoplasmic phosphorylation. The experiment was performed three times. One‐way ANOVA test. **P < 0.01; ****P < 0.0001. All values are expressed as the mean ± SEM.
- Representative immunoblot images indicating MYOD and vinculin expression in the total cell lysates of untreated and SD+ 5 mM Ca2+ and SD+ 5 mM Ca2++anti‐IGF2R and 5 mM Ca2+ +anti‐IGF2R‐treated C2C12 myoblasts; results were quantified and are shown as a ratio expressed in arbitrary units in the lower panel. Experiments were repeated three times. One‐way ANOVA test. **P < 0.01; ***P < 0.001; ****P < 0.0001. All values are expressed as the mean ± SEM.
Source data are available online for this figure.
