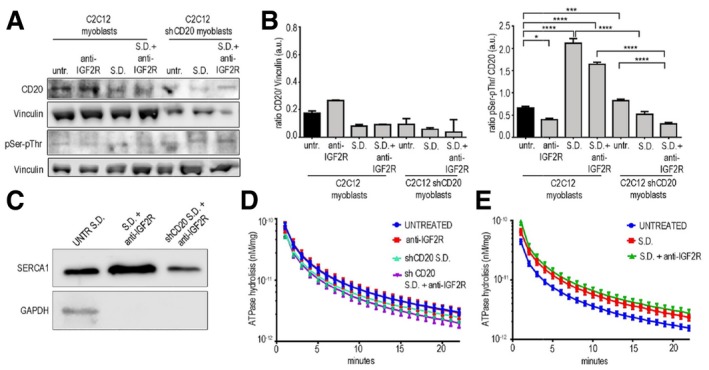
Figure EV4. SERCA modulation of blockade IGF2R.

-
ARepresentative WB of CD20 expression and pSer/pThr phosphorylation in C2C12 cells and shCD20‐treated C2C12 myoblasts before and after treatment with anti‐IGF2R, store depletion (SD) and SD+ anti‐IGF2R.
-
BDensitometric analysis is expressed as the ratio of CD20/vinculin and pSer/pThr/CD20 in arbitrary units. Two‐way ANOVA test; *P < 0.05; ***P < 0.001; ****P < 0.0001. Each experiment was performed in triplicate wells, and all values are expressed as the mean ± SEM.
-
CRepresentative WB images of SERCA1 and GAPDH expression in total lysates of untreated SD C2C12 cells and ER lysates of anti‐IGF2R‐treated SD C2C12 cells and SD+ shCD20‐treated C2C12 myoblasts.
-
D, ESERCA activity was quantified as ATPase hydrolysis activity vs. min in anti‐IGF2R‐treated, SD shCD20 C2C12 cells and shCD20 C2C12 + anti‐IGF2R cells (D) and in untreated C2C12 cells and SD and SD+ anti‐IGF2R‐treated C2C12 cells (E). Each experiment was performed in triplicate wells, and all values are expressed as the mean ± SEM.
Source data are available online for this figure.
