
FIGURE 4.
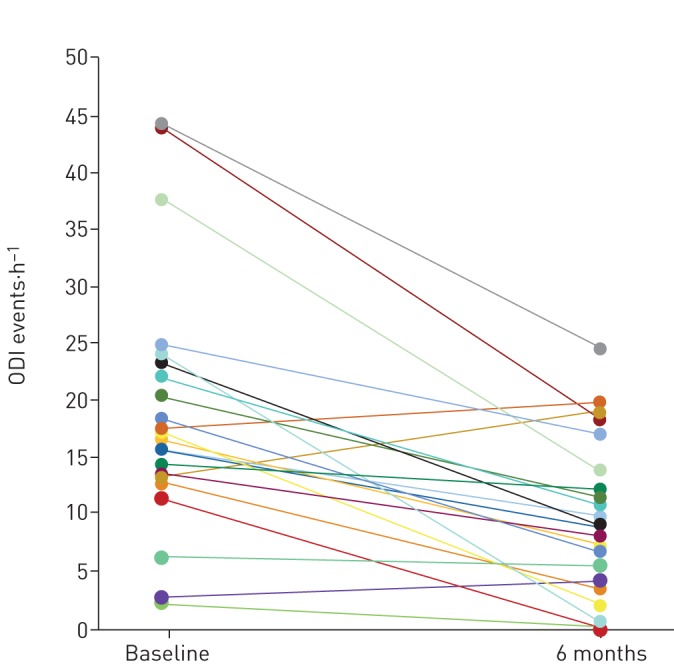
Change in 4% oxygen desaturation index (ODI) for each participant from baseline to 6 months post-implantation. Each line represents an individual participant using modified intention-to-treat analyses (n=22).
Official websites use .gov
A
.gov website belongs to an official
government organization in the United States.
Secure .gov websites use HTTPS
A lock (
) or https:// means you've safely
connected to the .gov website. Share sensitive
information only on official, secure websites.
Change in 4% oxygen desaturation index (ODI) for each participant from baseline to 6 months post-implantation. Each line represents an individual participant using modified intention-to-treat analyses (n=22).