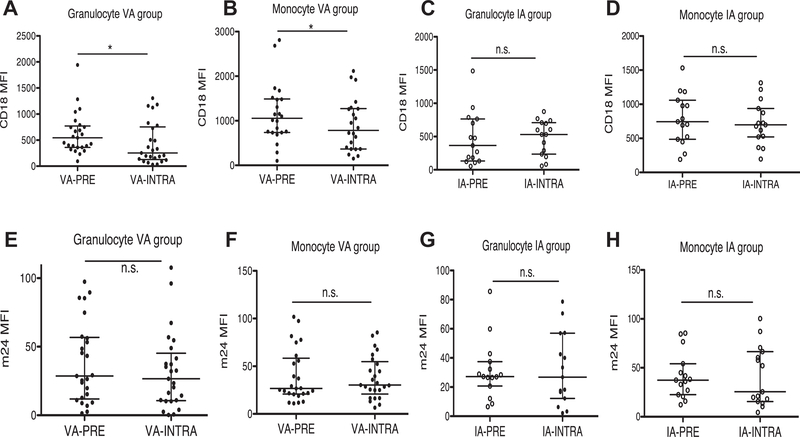
Fig. 3 –
CD18 and m24 expression level on granulocytes and monocytes in VA and IA groups. CD18 and m24 expression levels were probed by PE labeled anti-CD18 antibody and FITC labeled anti-m24 antibody, respectively. (A) CD18 expression on granulocytes in VA group, (B) CD18 expression on monocytes in VA group, (C) CD18 expression on granulocytes in IA group, (D) CD18 expression on monocytes in IA group, (E) m24 expression on granulocytes in VA group, (F) m24 expression on monocytes in VA group, (G) m24 expression on granulocytes in IA group, and (H) m24 expression on monocytes in IA group. Data were shown as median ± interquartile range. Statistical analysis was performed using Wilcoxon matched-pairs signed rank test. * denotes P < 0.05. IA-PRE = preoperative IA group; IA-INTRA = intraoperative IA group; n.s. = not significant; PE = phycoerythrin; VA-PRE = preoperative VA group; VA-INTRA = intraoperative VA group.

