
Figure 1.
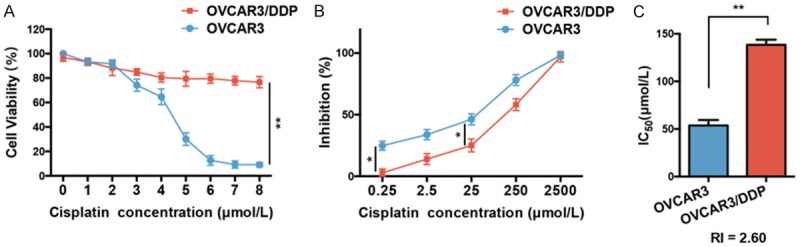
Establishment of the cisplatin-resistant OVCAR3/DDP cell line. A. The cell viability of OVCAR3 and OVCAR3/DDP cells were demonstrated by CCK-8 with different cisplatin concentrations (0-8 μmol/L), n = 5. B. The inhibition rate of cisplatin in OVCAR3 and OVCAR3/DDP groups, n = 5. C. The IC50 in each OVCAR3 and OVCAR3/DDP group, n = 5. The RI was 2.60. *P < 0.05, **P < 0.01 vs. indicated group. IC50: half maximal inhibitory concentration; RI: resistance index. Data were compared using a chi-square test and a one-way analysis of variance.