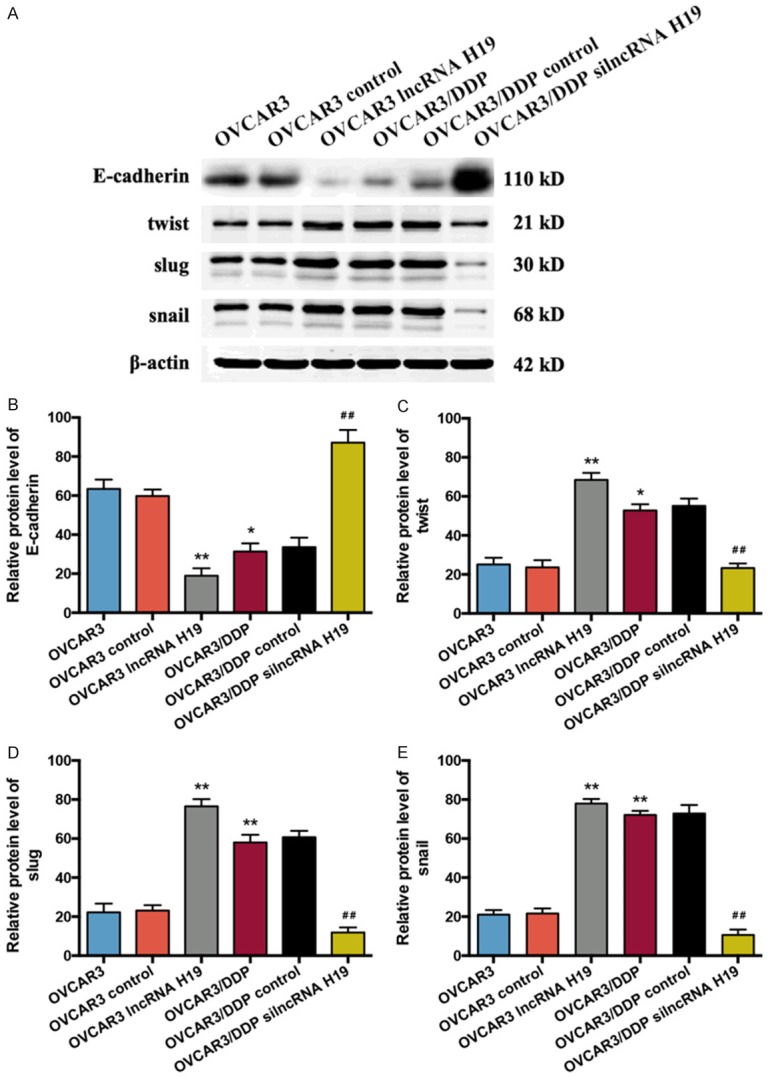
Figure 5.

Expression of E-cadherin, twist, slug, and snail proteins in OVCAR3 and OVCAR3/DDP cells. A. The protein expressions of E-cadherin, twist, slug, and snail in the OVCAR3 and OVCAR3/DDP cells were determined by western blot. B. Bar graph of western blot results of the E-cadherin expression in each group, n = 5. C. Bar graph of the western blot results of the twist expression in each group, n = 5. D. Bar graph of the western blot results of the slug expression in each group, n = 5. E. Bar graph of the western blot results of the snail expression in each group, n = 5. *P < 0.05, **P < 0.01 vs. OVCAR3 group, #P < 0.05, ##P < 0.01 vs. OVCAR3/DDP group. Data were compared using a one-way analysis of variance.
