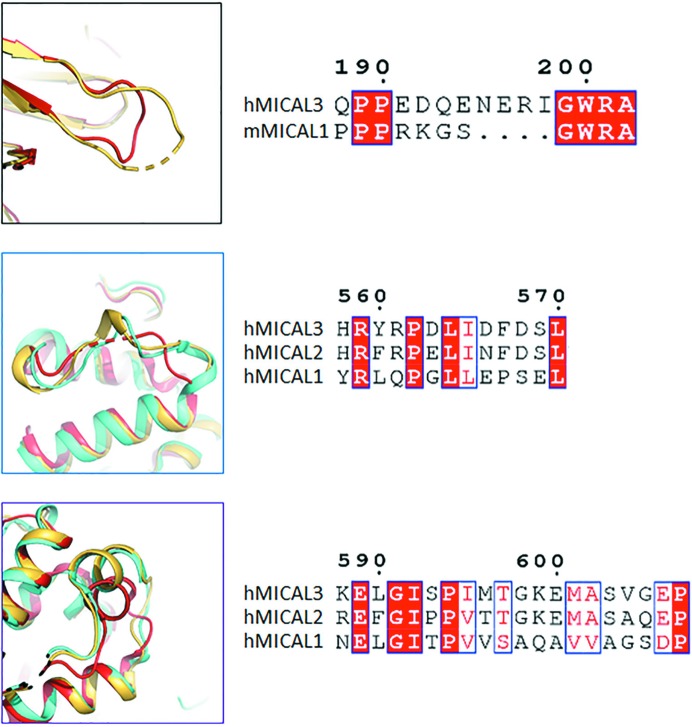
Figure 7.
Comparison of the FMO domain and CH domain of MICALs from human and mouse. The sequence alignments between the MICALs are shown on the right for the comparison regions shown on the left. The boxes on the left have the same colors as those highlighting the corresponding sequences in Fig. 1 ▸. In the top left panel, the loop region of the FMO domain of human MICAL3 is in yellow and red indicates the FMO domain of mouse MICAL1 (PDB entry 4txi). The middle and bottom left panels show the superimposition of the CH domain of human MICAL3 in yellow, human MICAL2 (PDB entry 2e9k; RIKEN Structural Genomics/Proteomics Initiative, unpublished work) in cyan and human MICAL1 (PDB entry 2dk9; Sun et al., 2006 ▸) in red.

