
Figure 2.
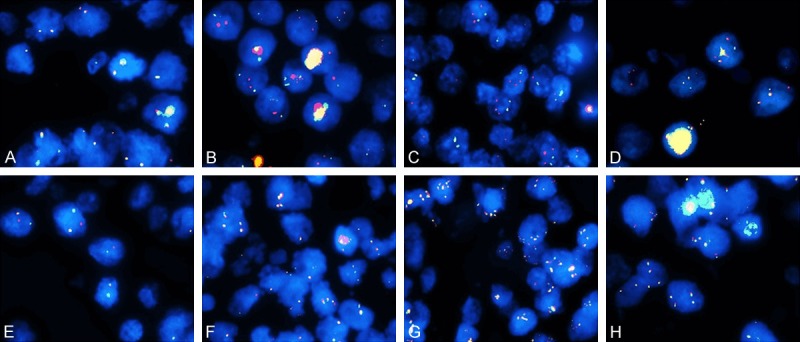
FISH analysis of the representative samples (all the samples were obtained at ×1000 magnification). A. Tumor cells with normal C-MYC as shown by the two yellow fusion signals in one nucleus. B. Tumor with normal BCL-2/IGH harboring two pairs of red and green signals in one nucleus. C. Tumor with BCL-2 ICN showing ≥3 red signals and two green signals in one nucleus. D. Tumor with BCL-2/IGH translocation with two yellow signals and a pair of red and green signals in one nucleus. E. Tumor with break-apart BCL-6 has one yellow signal and a pair of separated red and green signals in one nucleus. F. 3~5 yellow signals in one nucleus in a tumor with BCL-6 ICN. G. Tumor with BCL-6 gene amplification shows ≥6 yellow signals in one nucleus. H. 3~5 yellow signals in one nucleus of a tumor with C-MYC ICN. FISH, fluorescence in situ hybridization; ICN, increased copy number.