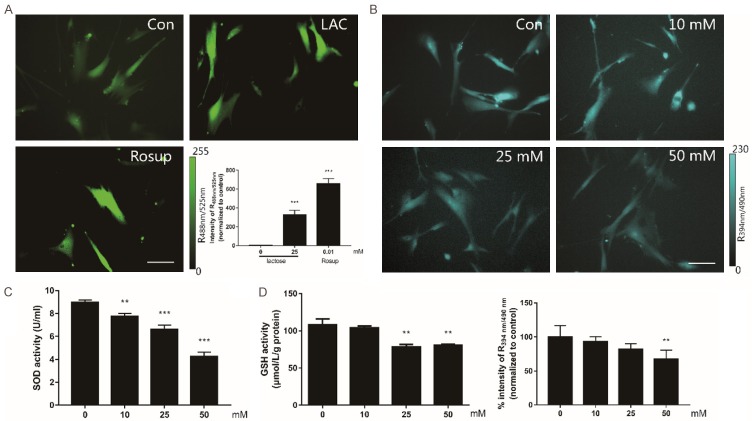
Figure 2.
Lactose induced intracellular oxidative stress. A. The cells treated with 25 mM lactose for 7 days. 100 μM Rosup treated as positive control. ROS stained by DCFH-DA dye and imaged by inversion fluorescence microscope. Scale bar =100 μm. B. The GSH level of living cells treated with lactose and imaged by inversion fluorescence microscope. Fluorescent image of GSH stained with mBCI dye. Scale bar =100 μm. C. The levels of SOD tested by SOD assay kit. Results obtained from three independent experiments and represented as an average ± SD. D. The levels of GSH tested by GSH assay kit and results obtained from three independent experiments and represented as average ± SD. *P<0.05, **P<0.01, ***P<0.001 (ANOVA): *Lactose versus vehicle.

