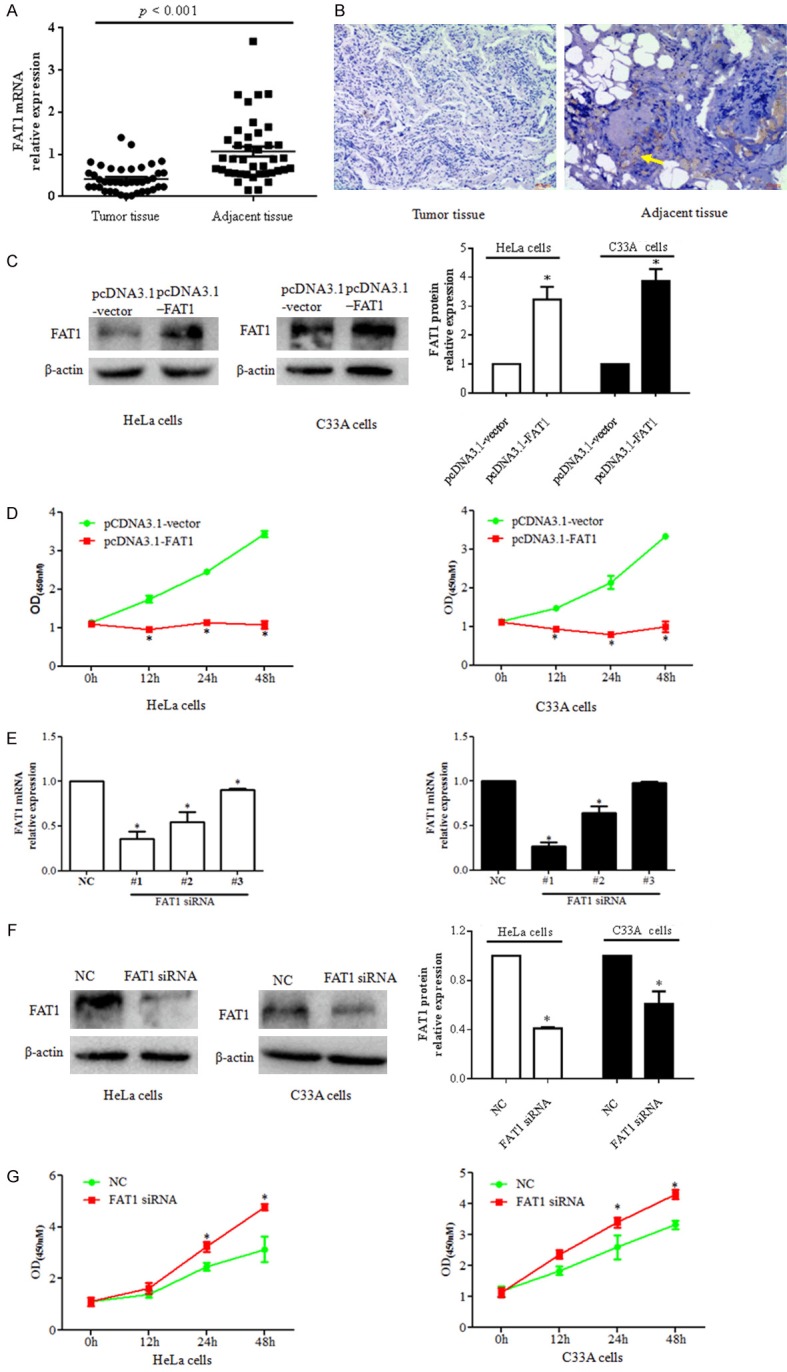
Figure 1.

FAT1 regulates cervical cancer cell proliferation. A. Relative expression of FAT1 mRNA was evaluated by qPCR. B. Immunohistochemical analysis of FAT1 protein expression and location in cervical cancer (right panel) and adjacent tissue (left panel). Immunoreactivity appears brown, with a blue hematoxylin counterstain. Scale bar, 40 μm. C. FAT1 expression in HeLa (right panel) and C33A cells (middle panel) transfected with the pcDNA3.1-FAT1 plasmid and pcDNA3.1-vector was evaluated by western blot. The histograms in the left panel illustrate the quantitative analysis of the FAT1 protein levels, which were normalized to the β-actin levels. *P < 0.05 vs. the pcDNA3.1-vector group. D. CCK-8 was used to analyse HeLa (right panel) and C33A cell (left panel) viability at the indicated time points. *P < 0.05 vs. pcDNA3.1-vector group. HeLa and C33A cells were transfected with pcDNA3. 1-FAT1 plasmid and pcDNA3.1-vector for 48 h, respectively. E. The relative expression of FAT1 was detected by qPCR. FAT1 mRNA was silenced by three FAT1 siRNA oligos in HeLa (left histogram) and C33A cells (right histogram) after three FAT1 siRNA sequences and NC were transfected into HeLa and C33A for 48 h, respectively. *P < 0.05 vs. the NC group. F. Western blot was used to analyse the relative expression levels of FAT1 proteins after treating cells with FAT1 siRNA for 48 h in HeLa (left panel) and C33A (middle panel) cells. The histograms in the left panel illustrate the quantitative analysis of the FAT1 protein levels, which were normalized to the β-actin levels. *P < 0.05 vs. NC group. G. CCK-8 was used to analyze the viability of HeLa (left panel) and C33A cells (right panel) at the indicated time points after transfection with FAT1 siRNA. *P < 0.05 vs. NC group.
