
Figure 1.
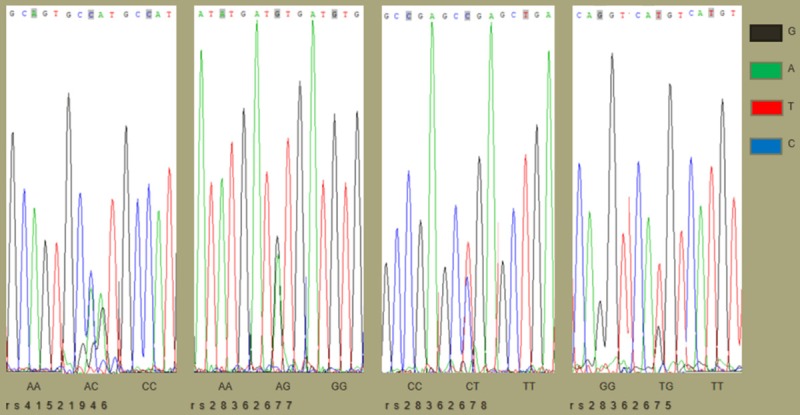
The adjacent sequences and genotypes of four SNP on the BTNL2 gene. The specific fragment of BTNL2 was amplified by the action of restriction endonucleases, and the genotypes of four SNP were determined by chromas peak mapping software after sequencing. The position of each light-colored shadow marker mutation site was judged by the peak map, the single peak was homozygous, and the double peak was heterozygous. The genotype of this locus is indicated below the graph. Each color represents a base, and black, green, red, and blue represent G, A, T, and C, respectively.