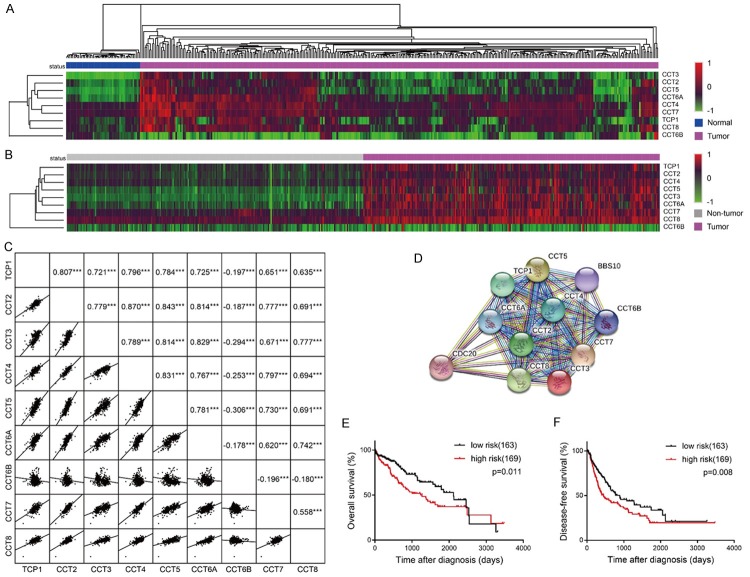
Figure 3.
The association among the expressions of the TRiC subunits. (A) Heat map displayed the RNA expression levels of TRiC subunits comparing HCC with normal liver samples in the TCGA dataset. The hierarchical clustering method was performed to cluster genes and disease status respectively. (B) A heat map displayed RNA expression of the TRiC subunits obtained from the GSE14520 dataset when comparing HCC with adjacent non-tumor samples. The hierarchical clustering method was performed according to the general expression levels of genes. (C) A scatterplot matrix analysis plotted the pairwise correlation among TRiC subunits according to the GSE14520 dataset. Correlation coefficients and p-values are presented in the upper right area. (D) Links to TCP1, CCT2, CCT3, CCT4, CCT5, CCT6A, CCT6B, CCT7, and CCT8 at the protein level were analyzed by STRING. (E) Overall survival analysis and (F) disease-free survival analysis of risk factors. High expressions of TCP1/CCT2/CCT3/CCT4/CCT5/CCT6A/CCT7/CCT8 as well as low expressions of CCT6B were defined as risk factors with the median of each gene as the cutoff, and 332 HCC patients from the TCGA dataset were grouped based on their number of risk factors. Patients with 0-4 risk factors were classified into the low risk group, and those with 5-9 risk factors were classified into the high risk group.

