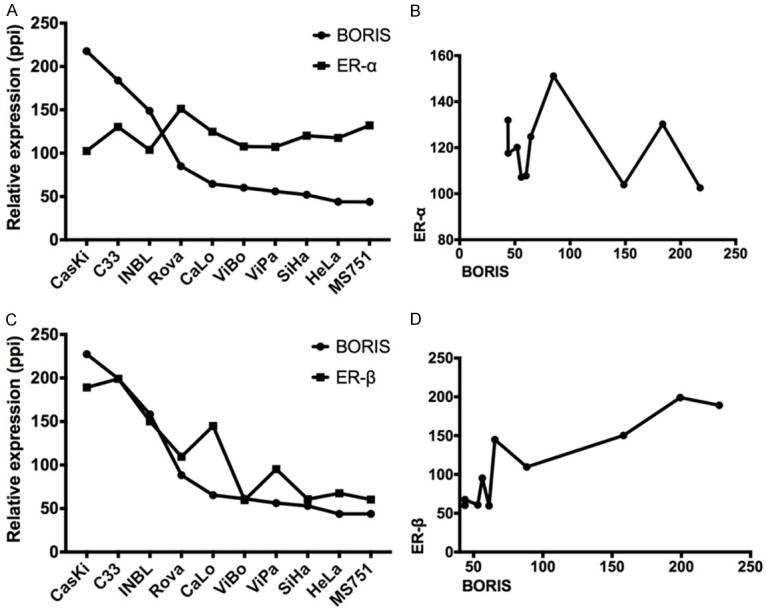
Figure 2.

Relative quantification of BORIS, ER-α, and ER-β transcripts. A. Relative expression of ER-α and BORIS, showing that ER-α apparently has no changes in all the cell lines evaluated. B. XY correlation data between ER-α and BORIS, showing a slightly negative correlation between the two transcripts. C. Relative expressions of ER-β and BORIS, showing a clear tendency of both transcripts to have similarities in their expressions. D. XY correlation data between ER-β and BORIS, showing a strong correlation behavior. (ppi = pixels per inch).
