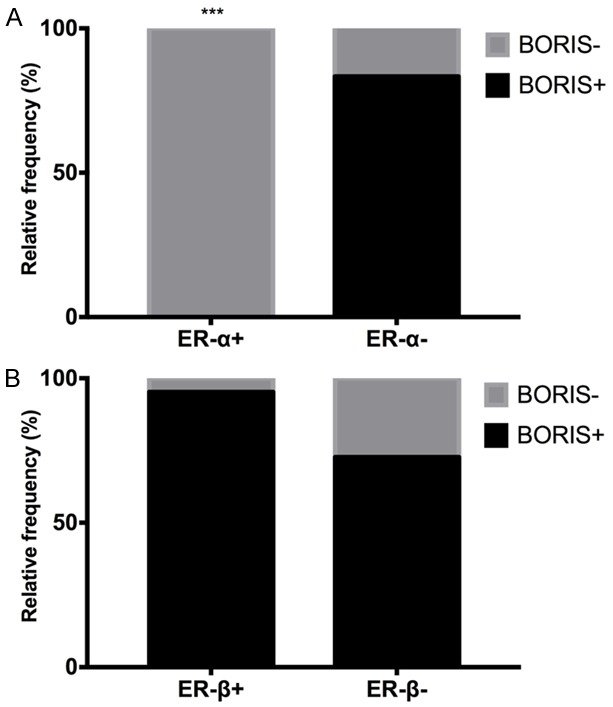
Figure 7.

Association between the BORIS protein and both estrogen receptors in the cervical tissues analyzed by IHC. A. The relative frequencies of ER-α and BORIS showed a negative association of ER-α and BORIS (P=0.0002). B. The relative frequency of ER-β and BORIS in which there was no significant association; nevertheless, a similar tendency of expression of both proteins was observed.
